| Param | Original file | Final file |
|---|---|---|
| Filename | modeM0/AS1A10_071T49_9000004462cztM0_level2_bc.evt | modeM0/AS1A10_071T49_9000004462cztM0_level2_quad_clean.evt |
| Size (bytes) | 4,561,588,800 | 859,674,240 |
| Size | 4.2 GB | 819.8 MB |
| Events in quadrant A | 17,040,282 | 5,692,386 |
| Events in quadrant B | 74,597,571 | 4,713,074 |
| Events in quadrant C | 17,074,028 | 5,415,770 |
| Events in quadrant D | 24,591,972 | 5,324,352 |
| Mode SS | |||
|---|---|---|---|
| Quadrant | BADHDUFLAG | Total packets | Discarded packets |
| A | 0 | 1448 | 0 |
| B | 0 | 1448 | 0 |
| C | 0 | 1448 | 0 |
| D | 0 | 1448 | 0 |
| Mode M0 | |||
|---|---|---|---|
| Quadrant | BADHDUFLAG | Total packets | Discarded packets |
| A | 0 | 154744 | 0 |
| B | 0 | 378089 | 0 |
| C | 0 | 156811 | 0 |
| D | 0 | 176481 | 0 |
| Mode M9 | |||
|---|---|---|---|
| Quadrant | BADHDUFLAG | Total packets | Discarded packets |
| A | 0 | 111 | 0 |
| B | 0 | 111 | 0 |
| C | 0 | 111 | 0 |
| D | 0 | 111 | 0 |
| Quadrant | Total seconds | Saturated seconds | Saturation percentage |
|---|---|---|---|
| A | 71255 | 1610 | 2.259491% |
| B | 71255 | 26685 | 37.450004% |
| C | 71255 | 1938 | 2.719809% |
| D | 71255 | 1732 | 2.430707% |
Noise dominated data is calculated using 1-second bins in cleaned event files. If a bin has >2000 counts, and if more than 50% of those come from <1% of pixels, then it is considered to be noise-dominated and hence unusable.
| Quadrant | # 1 sec bins | Bins with >0 counts | Bins with >2000 counts | High rate bins dominated by noise | Noise dominated (total time) | Noise dominated (detector-on time) | Marked lightcurve |
|---|---|---|---|---|---|---|---|
| A | 82450 | 71249 | 122 | 122 | 0.15% | 0.17% | 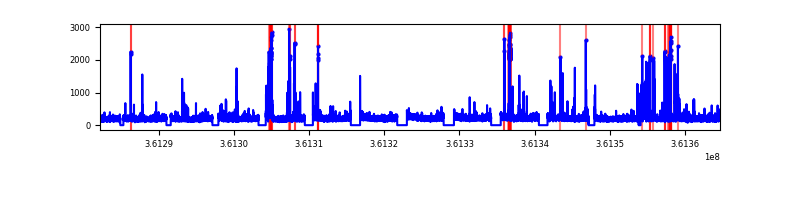 |
| B | 82450 | 71247 | 1505 | 1505 | 1.83% | 2.11% | 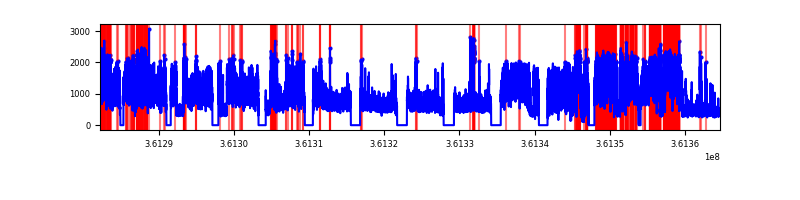 |
| C | 82450 | 71250 | 27 | 27 | 0.03% | 0.04% |  |
| D | 82450 | 71249 | 91 | 91 | 0.11% | 0.13% |  |
Top three noisy pixels from each quadrant. If the there are fewer than three noisy pixels in the level2.evt file, extra rows are filled as -1
| Pixel properties | Quadrant properties | ||||||
|---|---|---|---|---|---|---|---|
| Quadrant | DetID | PixID | Counts | Sigma | Mean | Median | Sigma |
| A | 0 | 13 | 1807946 | 2163.49 | 3928 | 3866 | 833.9 |
| A | 13 | 254 | 125968 | 146.43 | 3928 | 3866 | 833.9 |
| A | 12 | 96 | 29174 | 30.35 | 3928 | 3866 | 833.9 |
| B | 6 | 36 | 43676507 | 68044.1 | 3379 | 3310 | 641.8 |
| B | 6 | 159 | 16268394 | 25341.47 | 3379 | 3310 | 641.8 |
| B | 5 | 172 | 412225 | 637.1 | 3379 | 3310 | 641.8 |
| C | 2 | 16 | 1008328 | 1150.82 | 3737 | 3728 | 872.9 |
| C | 0 | 10 | 788362 | 898.84 | 3737 | 3728 | 872.9 |
| C | 3 | 233 | 621676 | 707.89 | 3737 | 3728 | 872.9 |
| D | 8 | 195 | 5725683 | 6646.8 | 3770 | 3669 | 860.9 |
| D | 12 | 233 | 2010347 | 2331.0 | 3770 | 3669 | 860.9 |
| D | 2 | 250 | 621704 | 717.92 | 3770 | 3669 | 860.9 |
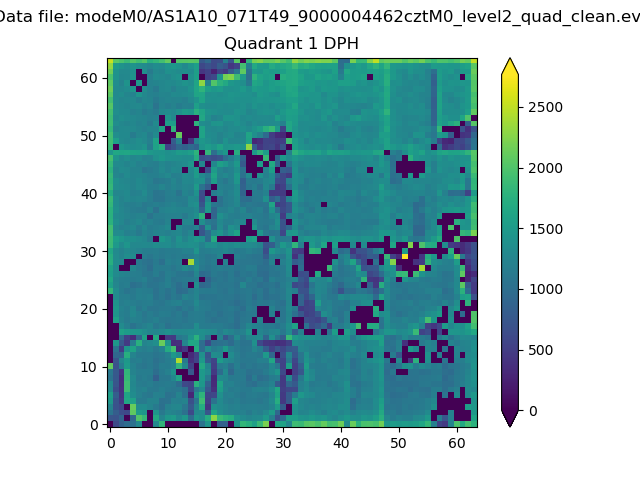
Histogram calculated using DETX and DETY for each event in the final _common_clean file
| Quadrant A |  |
 |
Quadrant B |
|---|---|---|---|
| Quadrant D |  |
 |
Quadrant C |
| Plot type | Count rate plots | Images |
|---|---|---|
| Comparison with Poisson distribution Blue bars denote a histogram of data divided into 1 sec bins. Red curve is a Poisson curve with rate = median count rate of data. |
 |
 |
| Quadrant-wise count rates Data is divided into 100 sec bins |
 |
|
| Module-wise count rates for Quadrant A Data is divided into 100 sec bins |
 |
 |
| Module-wise count rates for Quadrant B Data is divided into 100 sec bins |
 |
 |
| Module-wise count rates for Quadrant C Data is divided into 100 sec bins |
 |
 |
| Module-wise count rates for Quadrant D Data is divided into 100 sec bins |
 |
 |
| Parameter | Plot |
|---|---|
| CZT HV Monitor |  |
| D_VDD |  |
| Temperature 1 |  |
| Veto HV Monitor |  |
| Veto LLD |  |
| Alpha Counter |  |
| _CPM_Rate |  |
| CZT Counter |  |
| +2.5 Volts monitor |  |
| +5 Volts monitor |  |
| _ROLL_ROT | 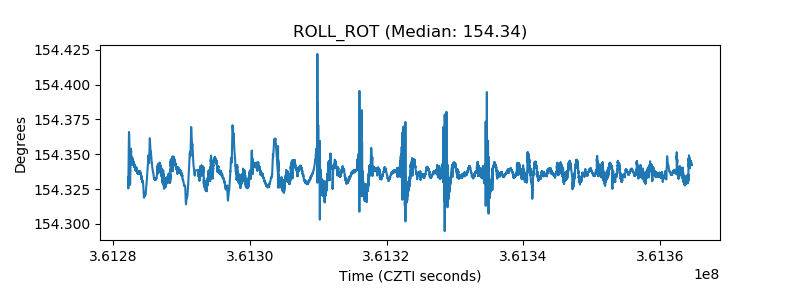 |
| _Roll_DEC |  |
| _Roll_RA | 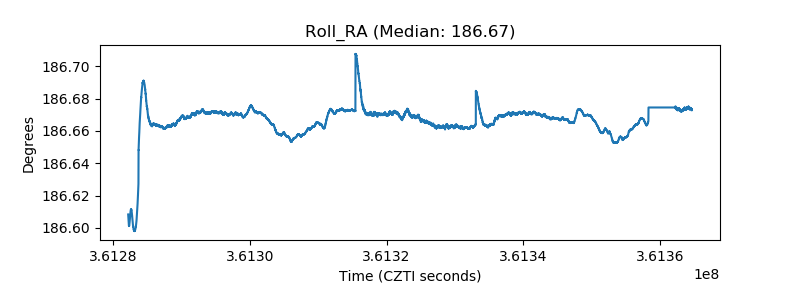 |
| Veto Counter | 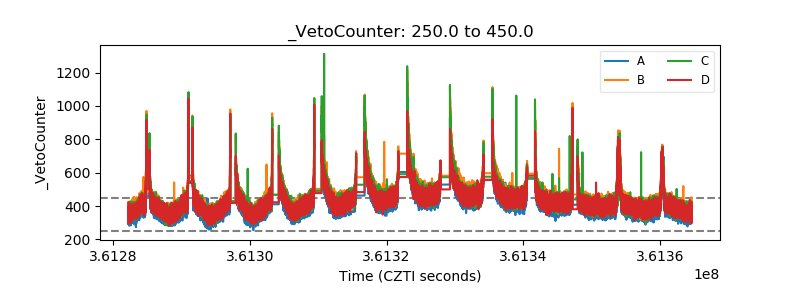 |