| Param | Original file | Final file |
|---|---|---|
| Filename | modeM0/AS1A10_071T46_9000004460cztM0_level2_bc.evt | modeM0/AS1A10_071T46_9000004460cztM0_level2_quad_clean.evt |
| Size (bytes) | 4,864,017,600 | 928,857,600 |
| Size | 4.5 GB | 885.8 MB |
| Events in quadrant A | 16,846,609 | 6,018,092 |
| Events in quadrant B | 82,080,371 | 5,617,117 |
| Events in quadrant C | 18,880,181 | 5,690,245 |
| Events in quadrant D | 24,372,543 | 5,622,186 |
| Mode M0 | |||
|---|---|---|---|
| Quadrant | BADHDUFLAG | Total packets | Discarded packets |
| A | 0 | 160011 | 0 |
| B | 0 | 381454 | 0 |
| C | 0 | 169197 | 0 |
| D | 0 | 180079 | 0 |
| Mode SS | |||
|---|---|---|---|
| Quadrant | BADHDUFLAG | Total packets | Discarded packets |
| A | 0 | 1536 | 0 |
| B | 0 | 1536 | 0 |
| C | 0 | 1536 | 0 |
| D | 0 | 1536 | 0 |
| Mode M9 | |||
|---|---|---|---|
| Quadrant | BADHDUFLAG | Total packets | Discarded packets |
| A | 0 | 115 | 0 |
| B | 0 | 115 | 0 |
| C | 0 | 115 | 0 |
| D | 0 | 115 | 0 |
| Quadrant | Total seconds | Saturated seconds | Saturation percentage |
|---|---|---|---|
| A | 75599 | 1386 | 1.833358% |
| B | 75599 | 17526 | 23.182846% |
| C | 75599 | 2343 | 3.099247% |
| D | 75599 | 1430 | 1.891559% |
Noise dominated data is calculated using 1-second bins in cleaned event files. If a bin has >2000 counts, and if more than 50% of those come from <1% of pixels, then it is considered to be noise-dominated and hence unusable.
| Quadrant | # 1 sec bins | Bins with >0 counts | Bins with >2000 counts | High rate bins dominated by noise | Noise dominated (total time) | Noise dominated (detector-on time) | Marked lightcurve |
|---|---|---|---|---|---|---|---|
| A | 87019 | 75594 | 16 | 16 | 0.02% | 0.02% |  |
| B | 87019 | 75590 | 1504 | 1504 | 1.73% | 1.99% |  |
| C | 87019 | 75593 | 72 | 72 | 0.08% | 0.10% |  |
| D | 87019 | 75593 | 194 | 194 | 0.22% | 0.26% |  |
Top three noisy pixels from each quadrant. If the there are fewer than three noisy pixels in the level2.evt file, extra rows are filled as -1
| Pixel properties | Quadrant properties | ||||||
|---|---|---|---|---|---|---|---|
| Quadrant | DetID | PixID | Counts | Sigma | Mean | Median | Sigma |
| A | 0 | 13 | 647179 | 717.91 | 4184 | 4120 | 895.7 |
| A | 13 | 254 | 136884 | 148.22 | 4184 | 4120 | 895.7 |
| A | 0 | 31 | 30921 | 29.92 | 4184 | 4120 | 895.7 |
| B | 6 | 36 | 45949925 | 60879.27 | 3979 | 3891 | 754.7 |
| B | 6 | 159 | 19494315 | 25825.14 | 3979 | 3891 | 754.7 |
| B | 5 | 172 | 351269 | 460.28 | 3979 | 3891 | 754.7 |
| C | 2 | 16 | 2095138 | 2272.54 | 3953 | 3940 | 920.2 |
| C | 0 | 10 | 803545 | 868.94 | 3953 | 3940 | 920.2 |
| C | 3 | 233 | 499394 | 538.42 | 3953 | 3940 | 920.2 |
| D | 8 | 195 | 6238881 | 6776.49 | 4015 | 3901 | 920.1 |
| D | 1 | 52 | 752063 | 813.14 | 4015 | 3901 | 920.1 |
| D | 2 | 250 | 700611 | 757.22 | 4015 | 3901 | 920.1 |
Histogram calculated using DETX and DETY for each event in the final _common_clean file
| Quadrant A |  |
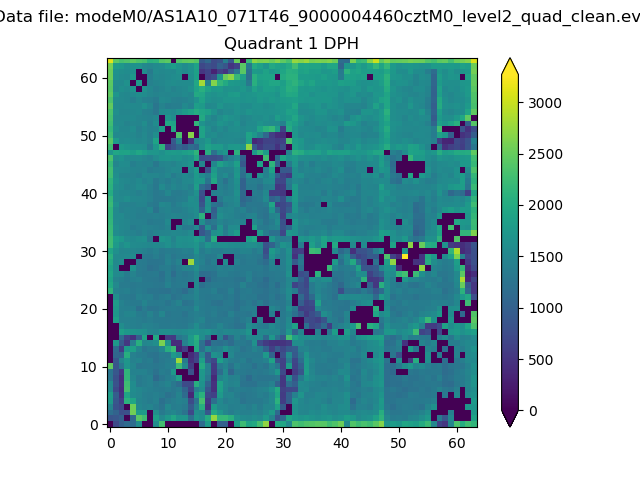 |
Quadrant B |
|---|---|---|---|
| Quadrant D |  |
 |
Quadrant C |
| Plot type | Count rate plots | Images |
|---|---|---|
| Comparison with Poisson distribution Blue bars denote a histogram of data divided into 1 sec bins. Red curve is a Poisson curve with rate = median count rate of data. |
 |
 |
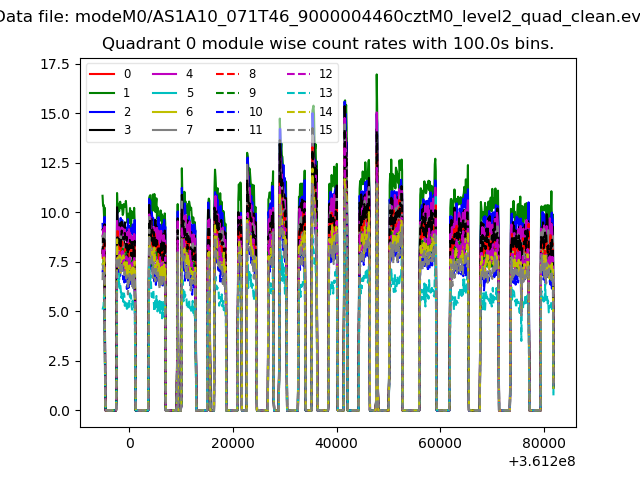
| Quadrant-wise count rates Data is divided into 100 sec bins |
 |
|
| Module-wise count rates for Quadrant A Data is divided into 100 sec bins |
 |
 |
| Module-wise count rates for Quadrant B Data is divided into 100 sec bins |
 |
 |
| Module-wise count rates for Quadrant C Data is divided into 100 sec bins |
 |
 |
| Module-wise count rates for Quadrant D Data is divided into 100 sec bins |
 |
 |
| Parameter | Plot |
|---|---|
| CZT HV Monitor | 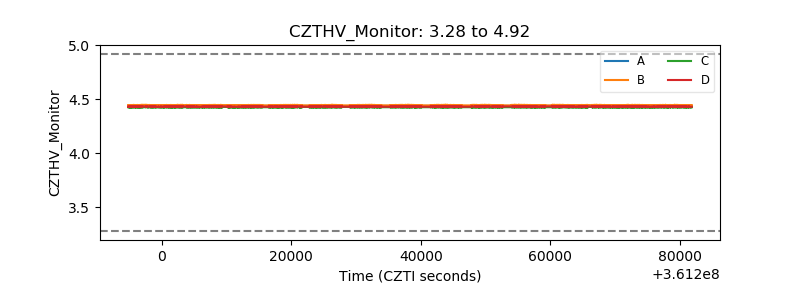 |
| D_VDD |  |
| Temperature 1 |  |
| Veto HV Monitor |  |
| Veto LLD |  |
| Alpha Counter |  |
| _CPM_Rate | 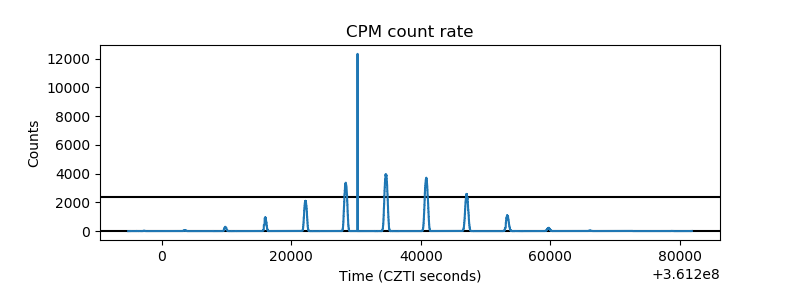 |
| CZT Counter |  |
| +2.5 Volts monitor |  |
| +5 Volts monitor |  |
| _ROLL_ROT | 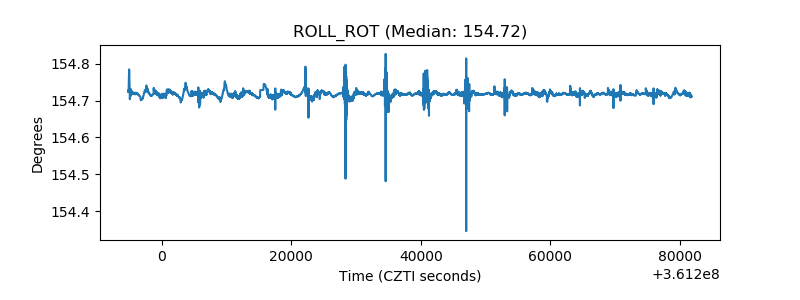 |
| _Roll_DEC | 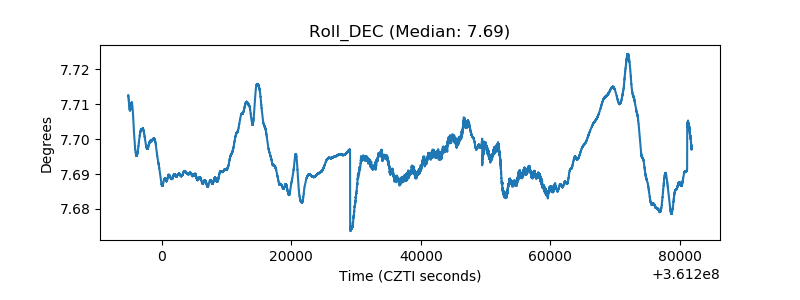 |
| _Roll_RA |  |
| Veto Counter |  |