| Param | Original file | Final file |
|---|---|---|
| Filename | modeM0/AS1C06_006T01_9000004456cztM0_level2_bc.evt | modeM0/AS1C06_006T01_9000004456cztM0_level2_quad_clean.evt |
| Size (bytes) | 315,325,440 | 96,275,520 |
| Size | 300.7 MB | 91.8 MB |
| Events in quadrant A | 1,469,342 | 619,541 |
| Events in quadrant B | 3,622,110 | 614,413 |
| Events in quadrant C | 1,822,738 | 584,741 |
| Events in quadrant D | 2,130,611 | 588,778 |
| Mode M0 | |||
|---|---|---|---|
| Quadrant | BADHDUFLAG | Total packets | Discarded packets |
| A | 0 | 15146 | 0 |
| B | 0 | 22401 | 0 |
| C | 0 | 16766 | 0 |
| D | 0 | 16452 | 0 |
| Mode SS | |||
|---|---|---|---|
| Quadrant | BADHDUFLAG | Total packets | Discarded packets |
| A | 0 | 146 | 0 |
| B | 0 | 146 | 0 |
| C | 0 | 146 | 0 |
| D | 0 | 146 | 0 |
| Quadrant | Total seconds | Saturated seconds | Saturation percentage |
|---|---|---|---|
| A | 7300 | 347 | 4.753425% |
| B | 7300 | 464 | 6.356164% |
| C | 7300 | 539 | 7.383562% |
| D | 7300 | 284 | 3.890411% |
Noise dominated data is calculated using 1-second bins in cleaned event files. If a bin has >2000 counts, and if more than 50% of those come from <1% of pixels, then it is considered to be noise-dominated and hence unusable.
| Quadrant | # 1 sec bins | Bins with >0 counts | Bins with >2000 counts | High rate bins dominated by noise | Noise dominated (total time) | Noise dominated (detector-on time) | Marked lightcurve |
|---|---|---|---|---|---|---|---|
| A | 7300 | 7300 | 0 | 0 | 0.00% | 0.00% |  |
| B | 7300 | 7300 | 3 | 3 | 0.04% | 0.04% |  |
| C | 7300 | 7300 | 0 | 0 | 0.00% | 0.00% |  |
| D | 7300 | 7300 | 10 | 10 | 0.14% | 0.14% |  |
Top three noisy pixels from each quadrant. If the there are fewer than three noisy pixels in the level2.evt file, extra rows are filled as -1
| Pixel properties | Quadrant properties | ||||||
|---|---|---|---|---|---|---|---|
| Quadrant | DetID | PixID | Counts | Sigma | Mean | Median | Sigma |
| A | 13 | 254 | 12659 | 141.61 | 379 | 372 | 86.8 |
| A | 12 | 194 | 2360 | 22.91 | 379 | 372 | 86.8 |
| A | 0 | 226 | 2265 | 21.82 | 379 | 372 | 86.8 |
| B | 6 | 159 | 1976294 | 26454.83 | 379 | 369 | 74.7 |
| B | 5 | 255 | 59199 | 787.65 | 379 | 369 | 74.7 |
| B | 0 | 230 | 51635 | 686.38 | 379 | 369 | 74.7 |
| C | 3 | 233 | 373516 | 4276.89 | 358 | 355 | 87.3 |
| C | 14 | 254 | 47895 | 544.87 | 358 | 355 | 87.3 |
| C | 2 | 114 | 13512 | 150.8 | 358 | 355 | 87.3 |
| D | 1 | 52 | 279834 | 3173.79 | 369 | 358 | 88.1 |
| D | 8 | 195 | 249983 | 2834.8 | 369 | 358 | 88.1 |
| D | 12 | 227 | 79026 | 893.37 | 369 | 358 | 88.1 |
Histogram calculated using DETX and DETY for each event in the final _common_clean file
| Quadrant A |  |
 |
Quadrant B |
|---|---|---|---|
| Quadrant D |  |
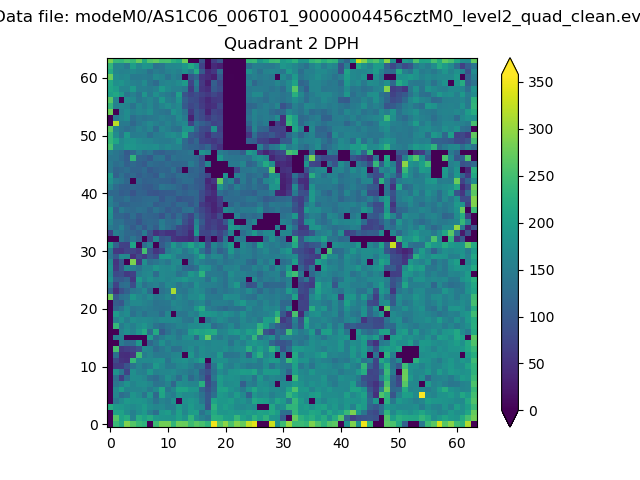 |
Quadrant C |
| Plot type | Count rate plots | Images |
|---|---|---|
| Comparison with Poisson distribution Blue bars denote a histogram of data divided into 1 sec bins. Red curve is a Poisson curve with rate = median count rate of data. |
 |
 |
| Quadrant-wise count rates Data is divided into 100 sec bins |
 |
|
| Module-wise count rates for Quadrant A Data is divided into 100 sec bins |
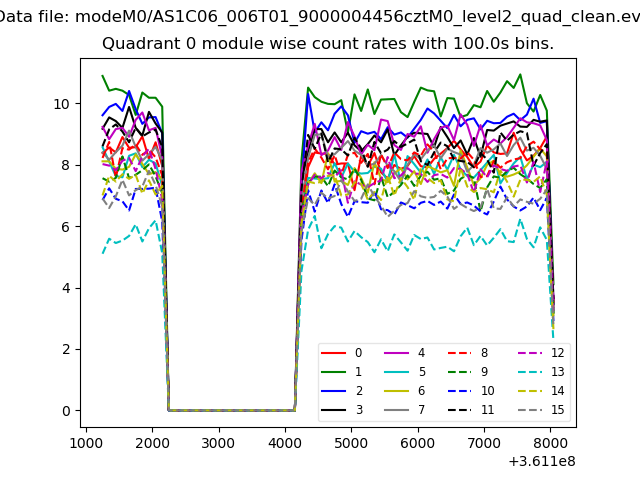 |
 |
| Module-wise count rates for Quadrant B Data is divided into 100 sec bins |
 |
 |
| Module-wise count rates for Quadrant C Data is divided into 100 sec bins |
 |
 |
| Module-wise count rates for Quadrant D Data is divided into 100 sec bins |
 |
 |
| Parameter | Plot |
|---|---|
| CZT HV Monitor |  |
| D_VDD |  |
| Temperature 1 |  |
| Veto HV Monitor | 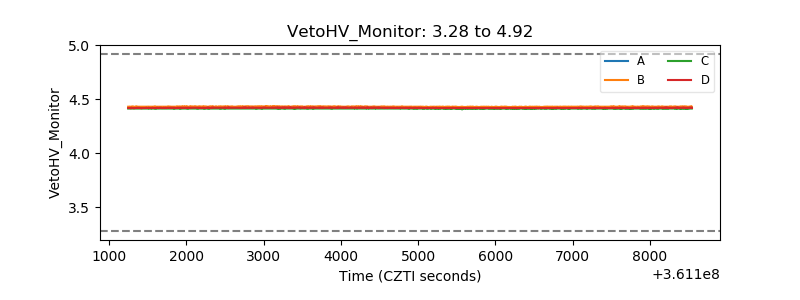 |
| Veto LLD |  |
| Alpha Counter |  |
| _CPM_Rate |  |
| CZT Counter |  |
| +2.5 Volts monitor | 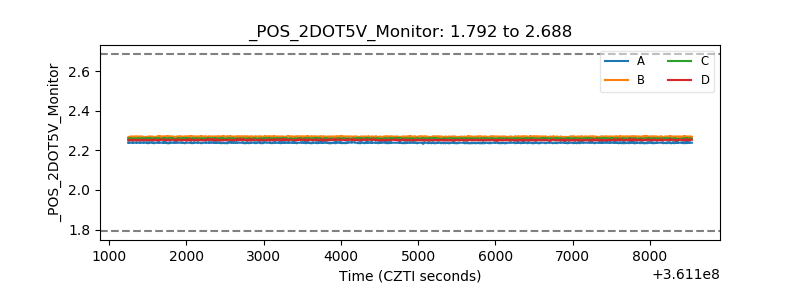 |
| +5 Volts monitor |  |
| _ROLL_ROT |  |
| _Roll_DEC |  |
| _Roll_RA |  |
| Veto Counter |  |