| Param | Original file | Final file |
|---|---|---|
| Filename | modeM0/AS1A10_071T40_9000004458cztM0_level2_bc.evt | modeM0/AS1A10_071T40_9000004458cztM0_level2_quad_clean.evt |
| Size (bytes) | 4,474,431,360 | 917,760,960 |
| Size | 4.2 GB | 875.2 MB |
| Events in quadrant A | 16,029,072 | 6,007,145 |
| Events in quadrant B | 71,492,826 | 5,427,572 |
| Events in quadrant C | 17,692,235 | 5,665,194 |
| Events in quadrant D | 25,249,838 | 5,604,075 |
| Mode M0 | |||
|---|---|---|---|
| Quadrant | BADHDUFLAG | Total packets | Discarded packets |
| A | 0 | 155455 | 0 |
| B | 0 | 349812 | 0 |
| C | 0 | 164179 | 0 |
| D | 0 | 182998 | 0 |
| Mode SS | |||
|---|---|---|---|
| Quadrant | BADHDUFLAG | Total packets | Discarded packets |
| A | 0 | 1512 | 0 |
| B | 0 | 1512 | 0 |
| C | 0 | 1512 | 0 |
| D | 0 | 1512 | 0 |
| Mode M9 | |||
|---|---|---|---|
| Quadrant | BADHDUFLAG | Total packets | Discarded packets |
| A | 0 | 111 | 0 |
| B | 0 | 111 | 0 |
| C | 0 | 111 | 0 |
| D | 0 | 111 | 0 |
| Quadrant | Total seconds | Saturated seconds | Saturation percentage |
|---|---|---|---|
| A | 74230 | 1464 | 1.972248% |
| B | 74230 | 20680 | 27.859356% |
| C | 74230 | 2553 | 3.439310% |
| D | 74230 | 1766 | 2.379092% |
Noise dominated data is calculated using 1-second bins in cleaned event files. If a bin has >2000 counts, and if more than 50% of those come from <1% of pixels, then it is considered to be noise-dominated and hence unusable.
| Quadrant | # 1 sec bins | Bins with >0 counts | Bins with >2000 counts | High rate bins dominated by noise | Noise dominated (total time) | Noise dominated (detector-on time) | Marked lightcurve |
|---|---|---|---|---|---|---|---|
| A | 85375 | 74226 | 13 | 13 | 0.02% | 0.02% | 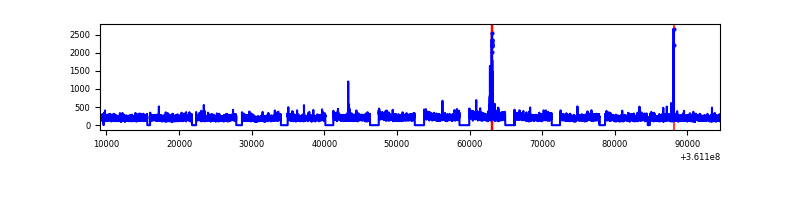 |
| B | 85375 | 74222 | 1546 | 1546 | 1.81% | 2.08% | 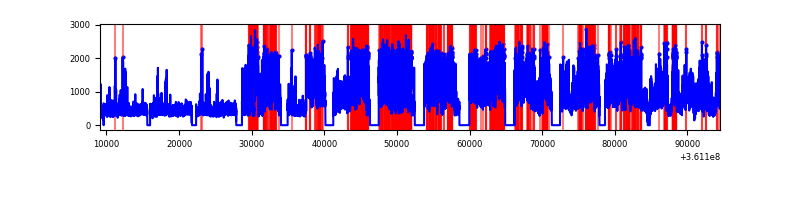 |
| C | 85375 | 74222 | 26 | 26 | 0.03% | 0.04% |  |
| D | 85375 | 74224 | 101 | 101 | 0.12% | 0.14% | 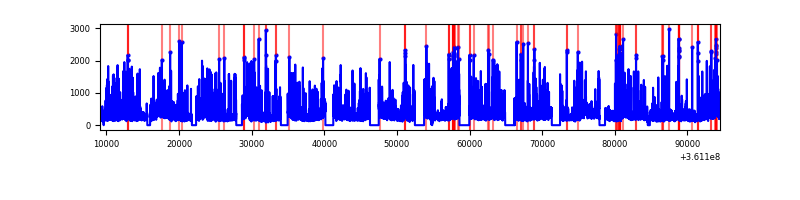 |
Top three noisy pixels from each quadrant. If the there are fewer than three noisy pixels in the level2.evt file, extra rows are filled as -1
| Pixel properties | Quadrant properties | ||||||
|---|---|---|---|---|---|---|---|
| Quadrant | DetID | PixID | Counts | Sigma | Mean | Median | Sigma |
| A | 13 | 254 | 130324 | 143.74 | 4112 | 4039 | 878.5 |
| A | 0 | 31 | 125629 | 138.4 | 4112 | 4039 | 878.5 |
| A | 15 | 192 | 26353 | 25.4 | 4112 | 4039 | 878.5 |
| B | 6 | 36 | 36701457 | 51032.78 | 3801 | 3718 | 719.1 |
| B | 6 | 159 | 18756075 | 26077.49 | 3801 | 3718 | 719.1 |
| B | 5 | 172 | 451474 | 622.66 | 3801 | 3718 | 719.1 |
| C | 3 | 233 | 1216563 | 1324.36 | 3885 | 3870 | 915.7 |
| C | 0 | 10 | 745176 | 809.57 | 3885 | 3870 | 915.7 |
| C | 2 | 16 | 437036 | 473.05 | 3885 | 3870 | 915.7 |
| D | 8 | 195 | 7108015 | 7830.32 | 3941 | 3826 | 907.3 |
| D | 1 | 52 | 1283072 | 1410.0 | 3941 | 3826 | 907.3 |
| D | 2 | 250 | 434515 | 474.71 | 3941 | 3826 | 907.3 |
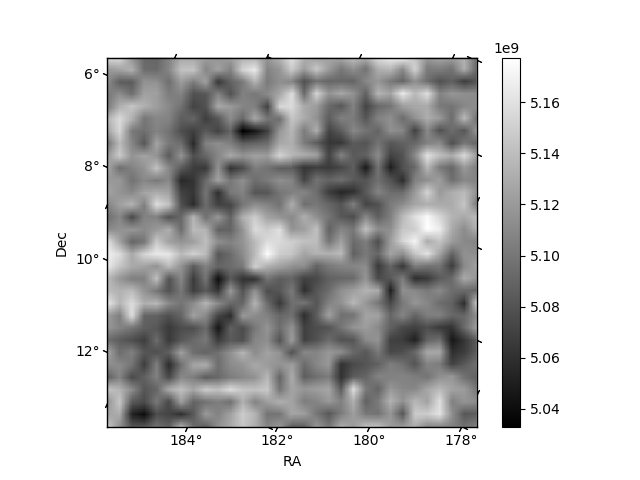
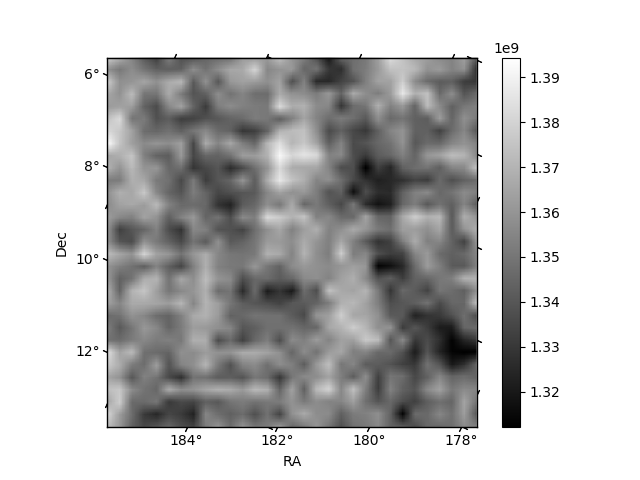
Histogram calculated using DETX and DETY for each event in the final _common_clean file
| Quadrant A |  |
 |
Quadrant B |
|---|---|---|---|
| Quadrant D |  |
 |
Quadrant C |
| Plot type | Count rate plots | Images |
|---|---|---|
| Comparison with Poisson distribution Blue bars denote a histogram of data divided into 1 sec bins. Red curve is a Poisson curve with rate = median count rate of data. |
 |
 |
| Quadrant-wise count rates Data is divided into 100 sec bins |
 |
|
| Module-wise count rates for Quadrant A Data is divided into 100 sec bins |
 |
 |
| Module-wise count rates for Quadrant B Data is divided into 100 sec bins |
 |
 |
| Module-wise count rates for Quadrant C Data is divided into 100 sec bins |
 |
 |
| Module-wise count rates for Quadrant D Data is divided into 100 sec bins |
 |
 |
| Parameter | Plot |
|---|---|
| CZT HV Monitor |  |
| D_VDD |  |
| Temperature 1 |  |
| Veto HV Monitor |  |
| Veto LLD |  |
| Alpha Counter |  |
| _CPM_Rate |  |
| CZT Counter |  |
| +2.5 Volts monitor | 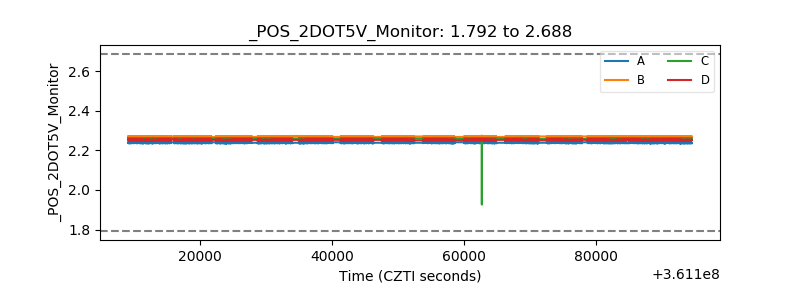 |
| +5 Volts monitor | 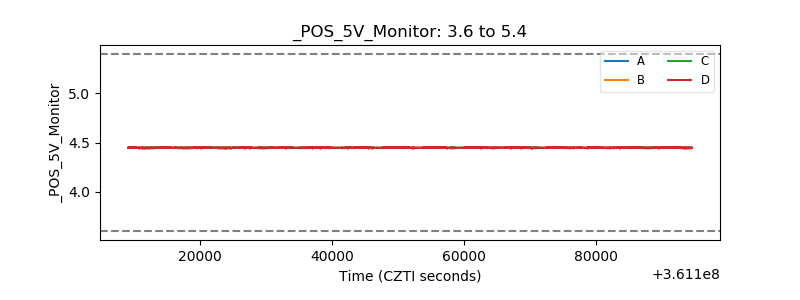 |
| _ROLL_ROT |  |
| _Roll_DEC |  |
| _Roll_RA | 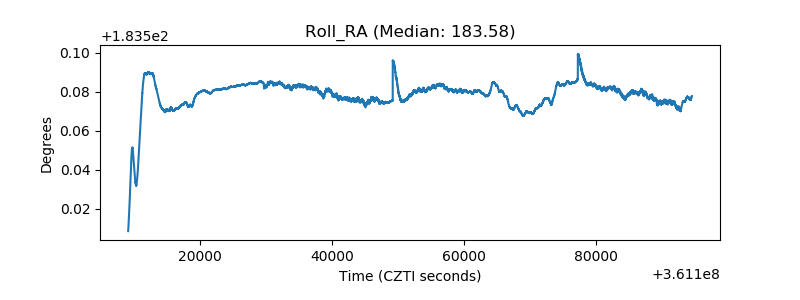 |
| Veto Counter |  |