| Param | Original file | Final file |
|---|---|---|
| Filename | modeM0/AS1A10_071T38_9000004454cztM0_level2_bc.evt | modeM0/AS1A10_071T38_9000004454cztM0_level2_quad_clean.evt |
| Size (bytes) | 3,774,404,160 | 854,637,120 |
| Size | 3.5 GB | 815.0 MB |
| Events in quadrant A | 15,177,959 | 5,532,859 |
| Events in quadrant B | 36,645,454 | 5,489,146 |
| Events in quadrant C | 17,486,018 | 5,175,235 |
| Events in quadrant D | 40,271,352 | 4,913,273 |
| Mode M9 | |||
|---|---|---|---|
| Quadrant | BADHDUFLAG | Total packets | Discarded packets |
| A | 0 | 115 | 0 |
| B | 0 | 115 | 0 |
| C | 0 | 115 | 0 |
| D | 0 | 115 | 0 |
| Mode M0 | |||
|---|---|---|---|
| Quadrant | BADHDUFLAG | Total packets | Discarded packets |
| A | 0 | 145836 | 0 |
| B | 0 | 220076 | 0 |
| C | 0 | 158160 | 0 |
| D | 0 | 236850 | 0 |
| Mode SS | |||
|---|---|---|---|
| Quadrant | BADHDUFLAG | Total packets | Discarded packets |
| A | 0 | 1416 | 0 |
| B | 0 | 1416 | 0 |
| C | 0 | 1416 | 0 |
| D | 0 | 1416 | 0 |
| Quadrant | Total seconds | Saturated seconds | Saturation percentage |
|---|---|---|---|
| A | 69629 | 975 | 1.400279% |
| B | 69629 | 2416 | 3.469819% |
| C | 69629 | 3161 | 4.539775% |
| D | 69629 | 5929 | 8.515130% |
Noise dominated data is calculated using 1-second bins in cleaned event files. If a bin has >2000 counts, and if more than 50% of those come from <1% of pixels, then it is considered to be noise-dominated and hence unusable.
| Quadrant | # 1 sec bins | Bins with >0 counts | Bins with >2000 counts | High rate bins dominated by noise | Noise dominated (total time) | Noise dominated (detector-on time) | Marked lightcurve |
|---|---|---|---|---|---|---|---|
| A | 80935 | 69621 | 7 | 7 | 0.01% | 0.01% | 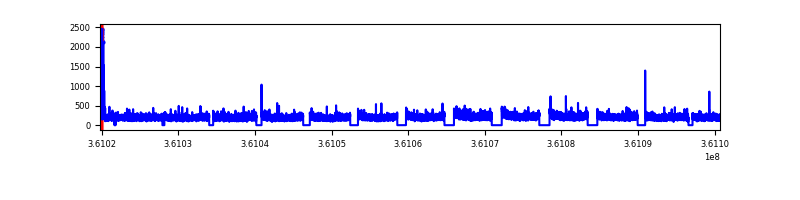 |
| B | 80935 | 69616 | 65 | 65 | 0.08% | 0.09% |  |
| C | 80935 | 69618 | 34 | 34 | 0.04% | 0.05% |  |
| D | 80935 | 69620 | 598 | 598 | 0.74% | 0.86% |  |
Top three noisy pixels from each quadrant. If the there are fewer than three noisy pixels in the level2.evt file, extra rows are filled as -1
| Pixel properties | Quadrant properties | ||||||
|---|---|---|---|---|---|---|---|
| Quadrant | DetID | PixID | Counts | Sigma | Mean | Median | Sigma |
| A | 0 | 13 | 184164 | 217.46 | 3877 | 3822 | 829.3 |
| A | 13 | 254 | 123995 | 144.91 | 3877 | 3822 | 829.3 |
| A | 0 | 226 | 24404 | 24.82 | 3877 | 3822 | 829.3 |
| B | 6 | 159 | 18837609 | 25907.47 | 3871 | 3780 | 727.0 |
| B | 5 | 255 | 856625 | 1173.16 | 3871 | 3780 | 727.0 |
| B | 6 | 36 | 474355 | 647.31 | 3871 | 3780 | 727.0 |
| C | 3 | 233 | 1671312 | 1968.04 | 3623 | 3616 | 847.4 |
| C | 0 | 10 | 974360 | 1145.57 | 3623 | 3616 | 847.4 |
| C | 2 | 16 | 289544 | 337.42 | 3623 | 3616 | 847.4 |
| D | 8 | 195 | 16958714 | 20539.31 | 3607 | 3508 | 825.5 |
| D | 12 | 218 | 3644147 | 4410.22 | 3607 | 3508 | 825.5 |
| D | 13 | 174 | 2863855 | 3464.99 | 3607 | 3508 | 825.5 |
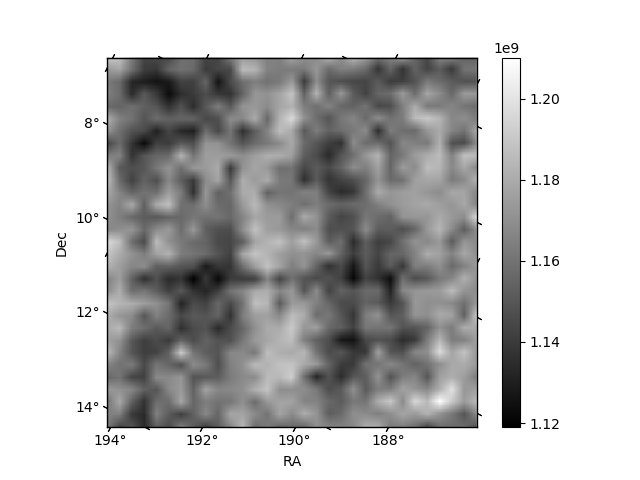
Histogram calculated using DETX and DETY for each event in the final _common_clean file
| Quadrant A |  |
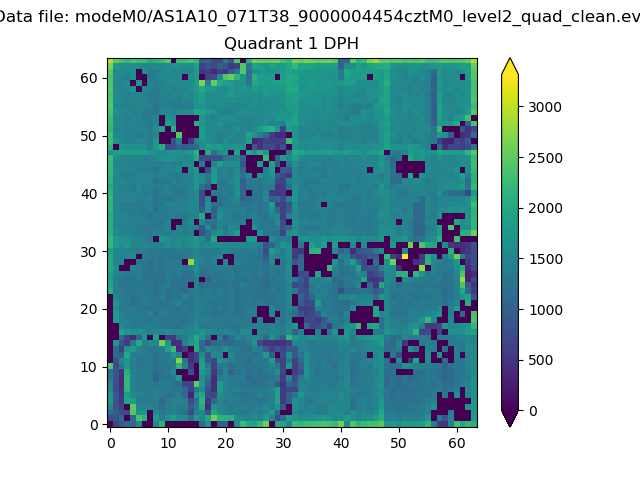 |
Quadrant B |
|---|---|---|---|
| Quadrant D |  |
 |
Quadrant C |
| Plot type | Count rate plots | Images |
|---|---|---|
| Comparison with Poisson distribution Blue bars denote a histogram of data divided into 1 sec bins. Red curve is a Poisson curve with rate = median count rate of data. |
 |
 |
| Quadrant-wise count rates Data is divided into 100 sec bins |
 |
|
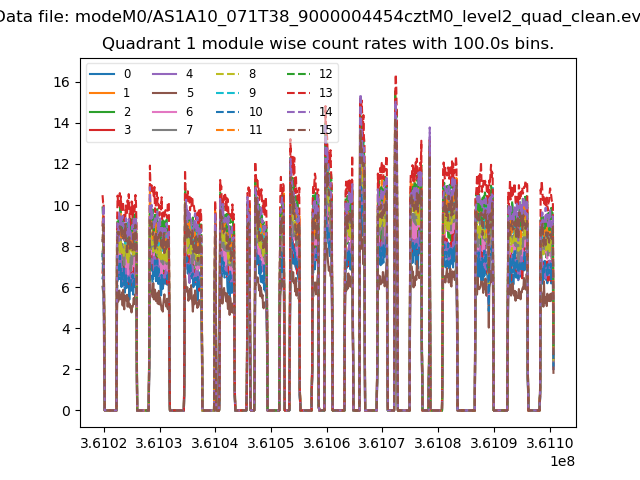
| Module-wise count rates for Quadrant A Data is divided into 100 sec bins |
 |
 |
| Module-wise count rates for Quadrant B Data is divided into 100 sec bins |
 |
 |
| Module-wise count rates for Quadrant C Data is divided into 100 sec bins |
 |
 |
| Module-wise count rates for Quadrant D Data is divided into 100 sec bins |
 |
 |
| Parameter | Plot |
|---|---|
| CZT HV Monitor |  |
| D_VDD |  |
| Temperature 1 | 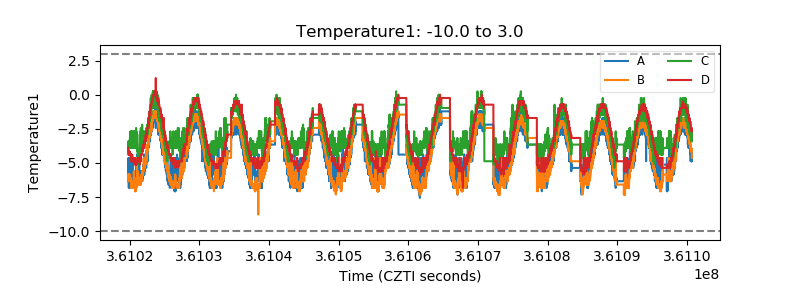 |
| Veto HV Monitor |  |
| Veto LLD |  |
| Alpha Counter |  |
| _CPM_Rate |  |
| CZT Counter |  |
| +2.5 Volts monitor | 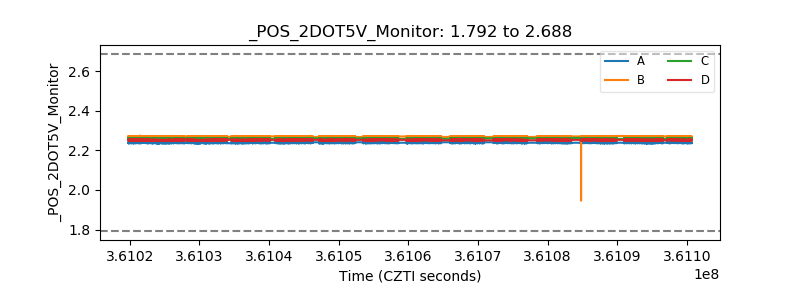 |
| +5 Volts monitor |  |
| _ROLL_ROT |  |
| _Roll_DEC |  |
| _Roll_RA | 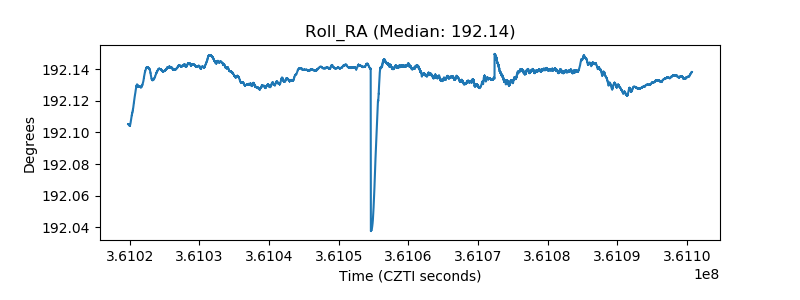 |
| Veto Counter |  |