| Param | Original file | Final file |
|---|---|---|
| Filename | modeM0/AS1C06_003T01_9000004452cztM0_level2_bc.evt | modeM0/AS1C06_003T01_9000004452cztM0_level2_quad_clean.evt |
| Size (bytes) | 4,728,867,840 | 1,275,053,760 |
| Size | 4.4 GB | 1.2 GB |
| Events in quadrant A | 19,089,419 | 8,728,746 |
| Events in quadrant B | 42,434,886 | 8,637,120 |
| Events in quadrant C | 22,962,208 | 8,299,007 |
| Events in quadrant D | 53,297,864 | 7,466,962 |
| Mode M9 | |||
|---|---|---|---|
| Quadrant | BADHDUFLAG | Total packets | Discarded packets |
| A | 0 | 125 | 0 |
| B | 0 | 125 | 0 |
| C | 0 | 125 | 0 |
| D | 0 | 125 | 0 |
| Mode M0 | |||
|---|---|---|---|
| Quadrant | BADHDUFLAG | Total packets | Discarded packets |
| A | 0 | 172849 | 0 |
| B | 0 | 252228 | 0 |
| C | 0 | 188066 | 0 |
| D | 0 | 299780 | 0 |
| Mode SS | |||
|---|---|---|---|
| Quadrant | BADHDUFLAG | Total packets | Discarded packets |
| A | 0 | 1630 | 0 |
| B | 0 | 1630 | 0 |
| C | 0 | 1630 | 0 |
| D | 0 | 1630 | 0 |
| Quadrant | Total seconds | Saturated seconds | Saturation percentage |
|---|---|---|---|
| A | 80033 | 1607 | 2.007922% |
| B | 80033 | 2965 | 3.704722% |
| C | 80033 | 2466 | 3.081229% |
| D | 80033 | 11325 | 14.150413% |
Noise dominated data is calculated using 1-second bins in cleaned event files. If a bin has >2000 counts, and if more than 50% of those come from <1% of pixels, then it is considered to be noise-dominated and hence unusable.
| Quadrant | # 1 sec bins | Bins with >0 counts | Bins with >2000 counts | High rate bins dominated by noise | Noise dominated (total time) | Noise dominated (detector-on time) | Marked lightcurve |
|---|---|---|---|---|---|---|---|
| A | 92328 | 80027 | 100 | 100 | 0.11% | 0.12% |  |
| B | 92328 | 80022 | 66 | 66 | 0.07% | 0.08% |  |
| C | 92328 | 80021 | 36 | 36 | 0.04% | 0.04% |  |
| D | 92328 | 80024 | 1738 | 1738 | 1.88% | 2.17% |  |
Top three noisy pixels from each quadrant. If the there are fewer than three noisy pixels in the level2.evt file, extra rows are filled as -1
| Pixel properties | Quadrant properties | ||||||
|---|---|---|---|---|---|---|---|
| Quadrant | DetID | PixID | Counts | Sigma | Mean | Median | Sigma |
| A | 0 | 13 | 2345260 | 2529.86 | 4297 | 4238 | 925.4 |
| A | 13 | 254 | 144783 | 151.88 | 4297 | 4238 | 925.4 |
| A | 12 | 96 | 95969 | 99.13 | 4297 | 4238 | 925.4 |
| B | 6 | 159 | 22452615 | 27731.99 | 4288 | 4196 | 809.5 |
| B | 5 | 172 | 1388043 | 1709.56 | 4288 | 4196 | 809.5 |
| B | 4 | 80 | 539707 | 661.55 | 4288 | 4196 | 809.5 |
| C | 3 | 233 | 5850420 | 6046.2 | 4081 | 4080 | 966.9 |
| C | 0 | 10 | 979313 | 1008.57 | 4081 | 4080 | 966.9 |
| C | 2 | 114 | 156214 | 157.33 | 4081 | 4080 | 966.9 |
| D | 8 | 195 | 25466170 | 28112.64 | 3890 | 3799 | 905.7 |
| D | 12 | 218 | 7138899 | 7877.76 | 3890 | 3799 | 905.7 |
| D | 2 | 250 | 1463255 | 1611.36 | 3890 | 3799 | 905.7 |
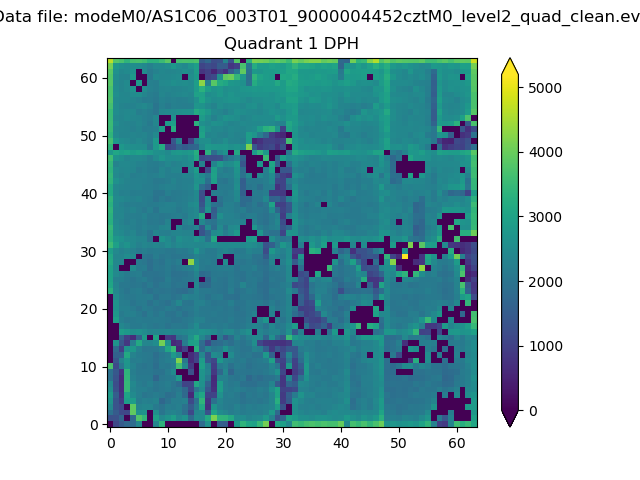
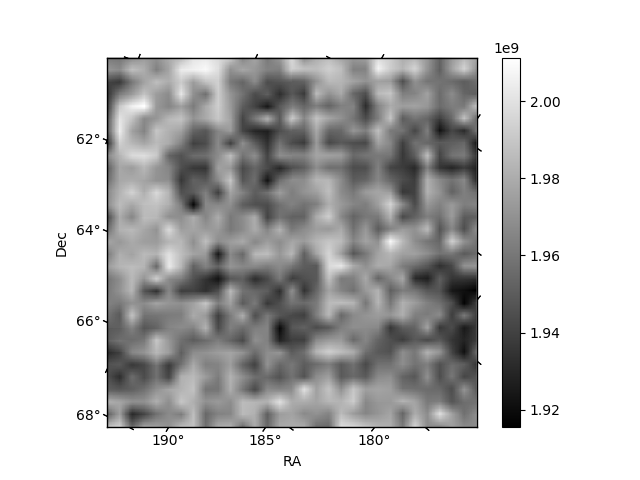
Histogram calculated using DETX and DETY for each event in the final _common_clean file
| Quadrant A |  |
 |
Quadrant B |
|---|---|---|---|
| Quadrant D | 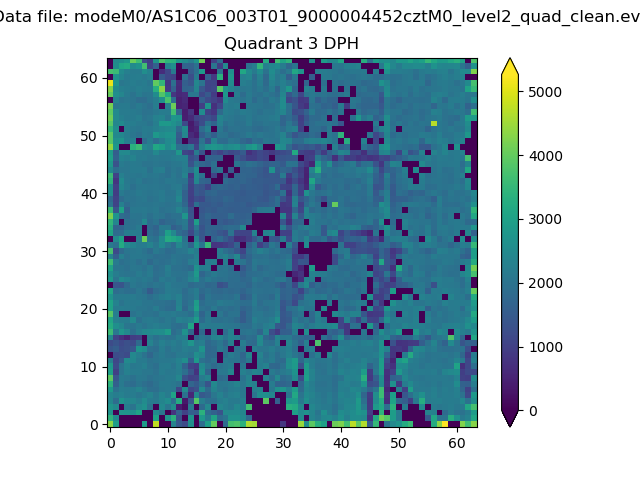 |
 |
Quadrant C |
| Plot type | Count rate plots | Images |
|---|---|---|
| Comparison with Poisson distribution Blue bars denote a histogram of data divided into 1 sec bins. Red curve is a Poisson curve with rate = median count rate of data. |
 |
 |
| Quadrant-wise count rates Data is divided into 100 sec bins |
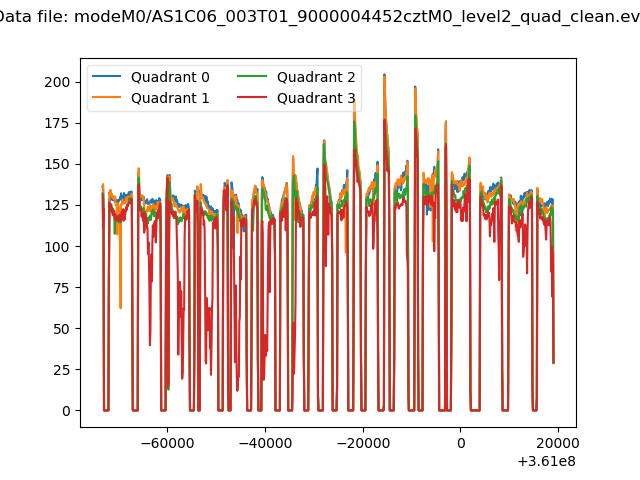 |
|
| Module-wise count rates for Quadrant A Data is divided into 100 sec bins |
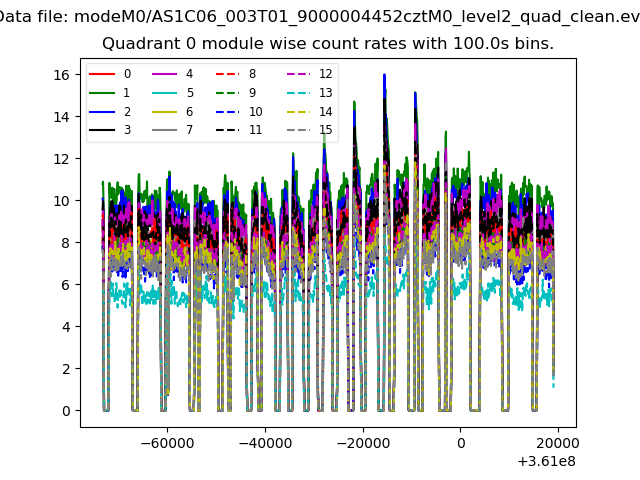 |
 |
| Module-wise count rates for Quadrant B Data is divided into 100 sec bins |
 |
 |
| Module-wise count rates for Quadrant C Data is divided into 100 sec bins |
 |
 |
| Module-wise count rates for Quadrant D Data is divided into 100 sec bins |
 |
 |
| Parameter | Plot |
|---|---|
| CZT HV Monitor |  |
| D_VDD |  |
| Temperature 1 |  |
| Veto HV Monitor | 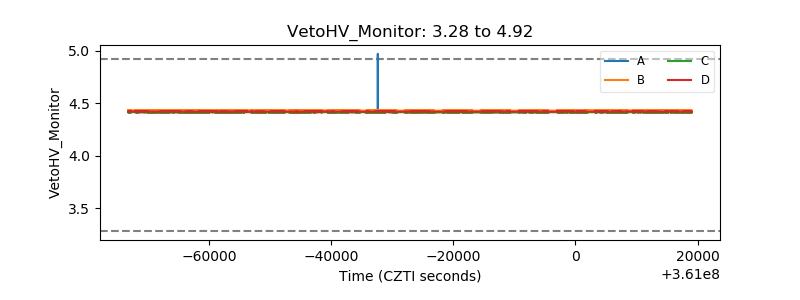 |
| Veto LLD |  |
| Alpha Counter |  |
| _CPM_Rate |  |
| CZT Counter | 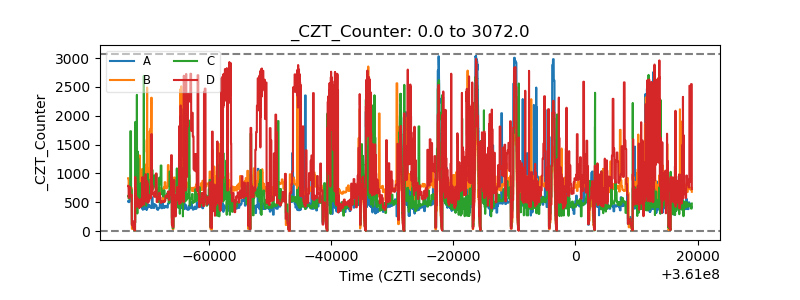 |
| +2.5 Volts monitor |  |
| +5 Volts monitor |  |
| _ROLL_ROT |  |
| _Roll_DEC | 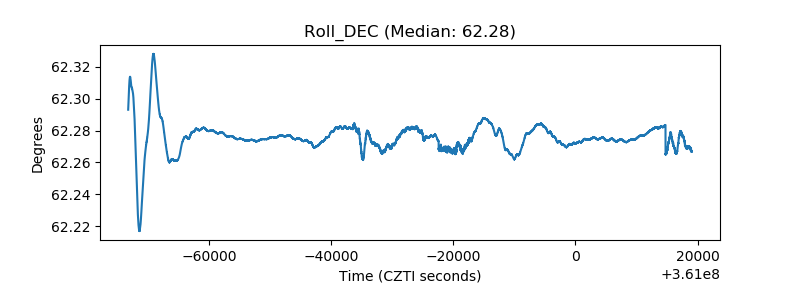 |
| _Roll_RA |  |
| Veto Counter |  |