| Param | Original file | Final file |
|---|---|---|
| Filename | modeM0/AS1A10_071T25_9000004450cztM0_level2_bc.evt | modeM0/AS1A10_071T25_9000004450cztM0_level2_quad_clean.evt |
| Size (bytes) | 4,148,403,840 | 874,241,280 |
| Size | 3.9 GB | 833.7 MB |
| Events in quadrant A | 15,217,065 | 5,657,366 |
| Events in quadrant B | 35,204,897 | 5,620,654 |
| Events in quadrant C | 23,708,391 | 5,274,687 |
| Events in quadrant D | 46,746,407 | 5,112,533 |
| Mode M0 | |||
|---|---|---|---|
| Quadrant | BADHDUFLAG | Total packets | Discarded packets |
| A | 0 | 146743 | 0 |
| B | 0 | 215711 | 0 |
| C | 0 | 180628 | 0 |
| D | 0 | 244775 | 0 |
| Mode SS | |||
|---|---|---|---|
| Quadrant | BADHDUFLAG | Total packets | Discarded packets |
| A | 0 | 1428 | 0 |
| B | 0 | 1428 | 0 |
| C | 0 | 1428 | 0 |
| D | 0 | 1428 | 0 |
| Mode M9 | |||
|---|---|---|---|
| Quadrant | BADHDUFLAG | Total packets | Discarded packets |
| A | 0 | 111 | 0 |
| B | 0 | 111 | 0 |
| C | 0 | 111 | 0 |
| D | 0 | 111 | 0 |
| Quadrant | Total seconds | Saturated seconds | Saturation percentage |
|---|---|---|---|
| A | 70199 | 1026 | 1.461559% |
| B | 70199 | 1988 | 2.831949% |
| C | 70199 | 2595 | 3.696634% |
| D | 70199 | 4597 | 6.548526% |
Noise dominated data is calculated using 1-second bins in cleaned event files. If a bin has >2000 counts, and if more than 50% of those come from <1% of pixels, then it is considered to be noise-dominated and hence unusable.
| Quadrant | # 1 sec bins | Bins with >0 counts | Bins with >2000 counts | High rate bins dominated by noise | Noise dominated (total time) | Noise dominated (detector-on time) | Marked lightcurve |
|---|---|---|---|---|---|---|---|
| A | 81270 | 70192 | 1 | 1 | 0.00% | 0.00% |  |
| B | 81270 | 70189 | 106 | 106 | 0.13% | 0.15% | 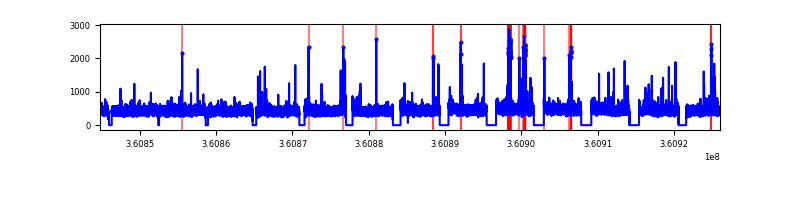 |
| C | 81270 | 70191 | 32 | 32 | 0.04% | 0.05% |  |
| D | 81270 | 70192 | 1973 | 1973 | 2.43% | 2.81% |  |
Top three noisy pixels from each quadrant. If the there are fewer than three noisy pixels in the level2.evt file, extra rows are filled as -1
| Pixel properties | Quadrant properties | ||||||
|---|---|---|---|---|---|---|---|
| Quadrant | DetID | PixID | Counts | Sigma | Mean | Median | Sigma |
| A | 13 | 254 | 123166 | 141.14 | 3936 | 3867 | 845.2 |
| A | 0 | 226 | 24590 | 24.52 | 3936 | 3867 | 845.2 |
| A | 12 | 194 | 23226 | 22.9 | 3936 | 3867 | 845.2 |
| B | 6 | 159 | 18773483 | 25447.97 | 3937 | 3849 | 737.6 |
| B | 5 | 255 | 625638 | 843.02 | 3937 | 3849 | 737.6 |
| B | 0 | 190 | 196214 | 260.81 | 3937 | 3849 | 737.6 |
| C | 3 | 233 | 8227070 | 9514.97 | 3688 | 3674 | 864.3 |
| C | 0 | 10 | 1092321 | 1259.63 | 3688 | 3674 | 864.3 |
| C | 2 | 114 | 131917 | 148.38 | 3688 | 3674 | 864.3 |
| D | 8 | 195 | 30931183 | 35464.83 | 3711 | 3622 | 872.1 |
| D | 2 | 250 | 395114 | 448.93 | 3711 | 3622 | 872.1 |
| D | 13 | 249 | 370526 | 420.73 | 3711 | 3622 | 872.1 |
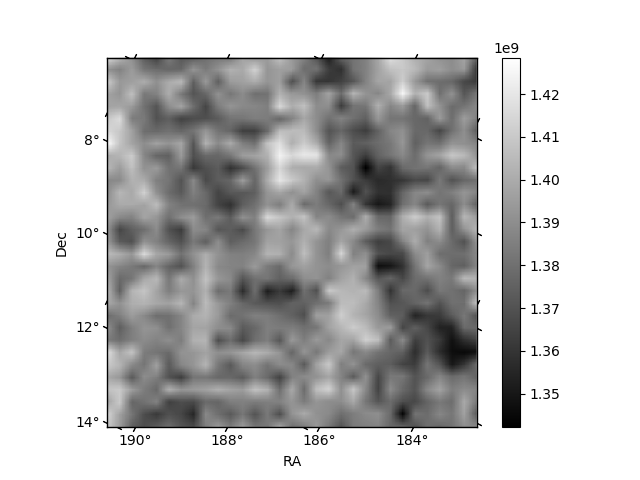
Histogram calculated using DETX and DETY for each event in the final _common_clean file
| Quadrant A |  |
 |
Quadrant B |
|---|---|---|---|
| Quadrant D | 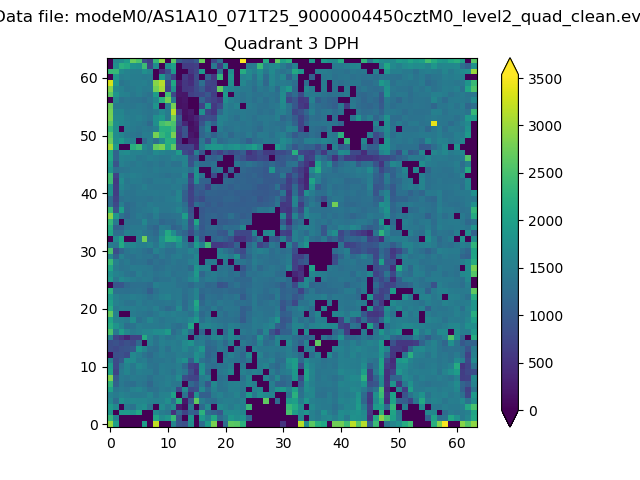 |
 |
Quadrant C |
| Plot type | Count rate plots | Images |
|---|---|---|
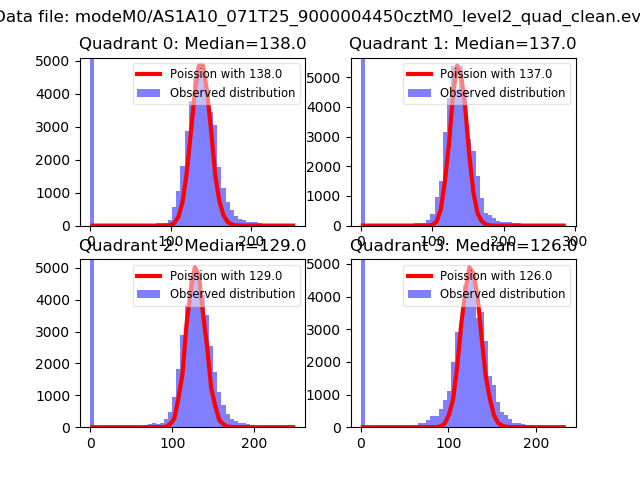
| Comparison with Poisson distribution Blue bars denote a histogram of data divided into 1 sec bins. Red curve is a Poisson curve with rate = median count rate of data. |
 |
 |
| Quadrant-wise count rates Data is divided into 100 sec bins |
 |
|
| Module-wise count rates for Quadrant A Data is divided into 100 sec bins |
 |
 |
| Module-wise count rates for Quadrant B Data is divided into 100 sec bins |
 |
 |
| Module-wise count rates for Quadrant C Data is divided into 100 sec bins |
 |
 |
| Module-wise count rates for Quadrant D Data is divided into 100 sec bins |
 |
 |
| Parameter | Plot |
|---|---|
| CZT HV Monitor |  |
| D_VDD |  |
| Temperature 1 |  |
| Veto HV Monitor | 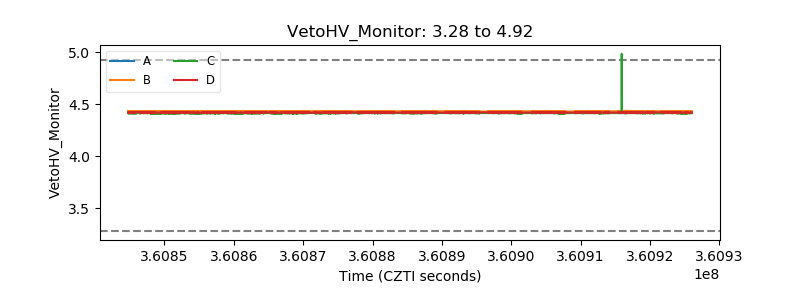 |
| Veto LLD |  |
| Alpha Counter |  |
| _CPM_Rate | 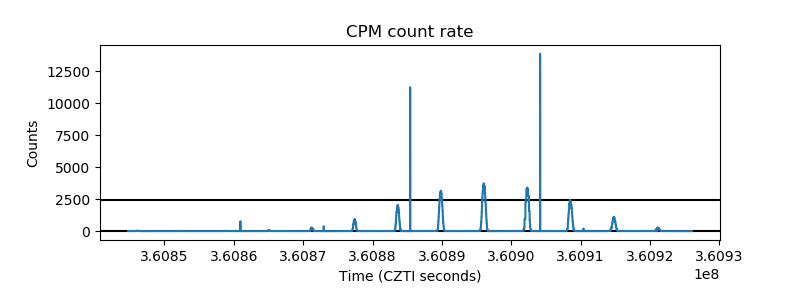 |
| CZT Counter |  |
| +2.5 Volts monitor |  |
| +5 Volts monitor |  |
| _ROLL_ROT | 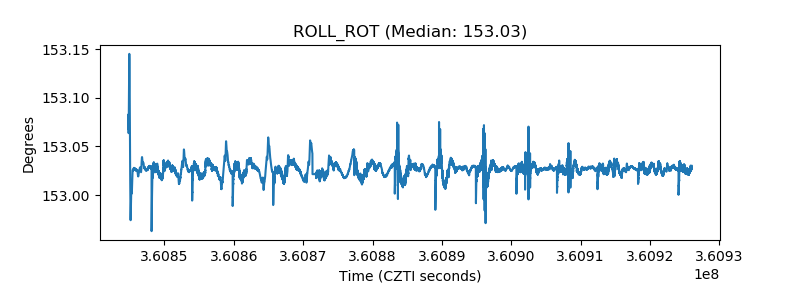 |
| _Roll_DEC |  |
| _Roll_RA |  |
| Veto Counter |  |