| Param | Original file | Final file |
|---|---|---|
| Filename | modeM0/AS1A10_071T18_9000004448cztM0_level2_bc.evt | modeM0/AS1A10_071T18_9000004448cztM0_level2_quad_clean.evt |
| Size (bytes) | 4,379,572,800 | 882,267,840 |
| Size | 4.1 GB | 841.4 MB |
| Events in quadrant A | 17,633,656 | 5,734,263 |
| Events in quadrant B | 34,930,673 | 5,717,471 |
| Events in quadrant C | 21,973,380 | 5,354,486 |
| Events in quadrant D | 53,341,323 | 5,100,276 |
| Mode SS | |||
|---|---|---|---|
| Quadrant | BADHDUFLAG | Total packets | Discarded packets |
| A | 0 | 1426 | 0 |
| B | 0 | 1426 | 0 |
| C | 0 | 1426 | 0 |
| D | 0 | 1426 | 0 |
| Mode M9 | |||
|---|---|---|---|
| Quadrant | BADHDUFLAG | Total packets | Discarded packets |
| A | 0 | 116 | 0 |
| B | 0 | 116 | 0 |
| C | 0 | 116 | 0 |
| D | 0 | 116 | 0 |
| Mode M0 | |||
|---|---|---|---|
| Quadrant | BADHDUFLAG | Total packets | Discarded packets |
| A | 0 | 155252 | 0 |
| B | 0 | 214439 | 0 |
| C | 0 | 176228 | 0 |
| D | 0 | 267089 | 0 |
| Quadrant | Total seconds | Saturated seconds | Saturation percentage |
|---|---|---|---|
| A | 70226 | 1353 | 1.926637% |
| B | 70226 | 1655 | 2.356677% |
| C | 70226 | 2768 | 3.941560% |
| D | 70226 | 5689 | 8.100988% |
Noise dominated data is calculated using 1-second bins in cleaned event files. If a bin has >2000 counts, and if more than 50% of those come from <1% of pixels, then it is considered to be noise-dominated and hence unusable.
| Quadrant | # 1 sec bins | Bins with >0 counts | Bins with >2000 counts | High rate bins dominated by noise | Noise dominated (total time) | Noise dominated (detector-on time) | Marked lightcurve |
|---|---|---|---|---|---|---|---|
| A | 81641 | 70216 | 50 | 50 | 0.06% | 0.07% | 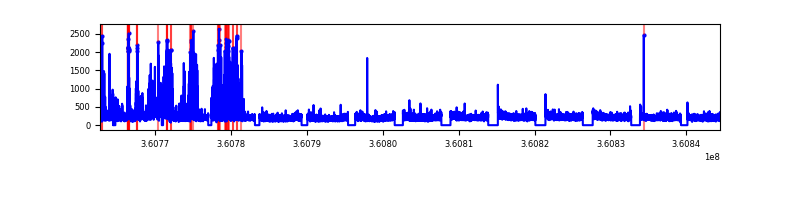 |
| B | 81641 | 70215 | 9 | 9 | 0.01% | 0.01% | 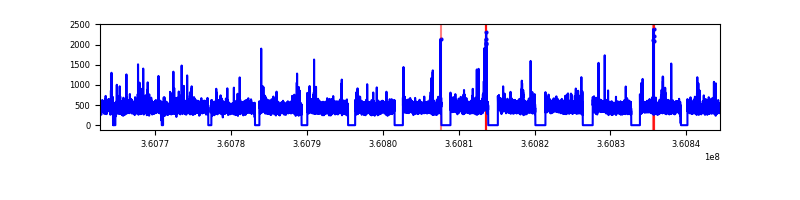 |
| C | 81641 | 70215 | 98 | 98 | 0.12% | 0.14% |  |
| D | 81641 | 70218 | 1608 | 1608 | 1.97% | 2.29% | 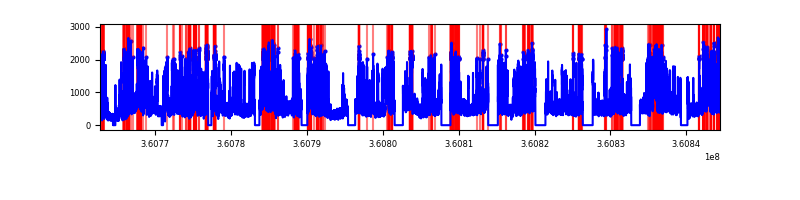 |
Top three noisy pixels from each quadrant. If the there are fewer than three noisy pixels in the level2.evt file, extra rows are filled as -1
| Pixel properties | Quadrant properties | ||||||
|---|---|---|---|---|---|---|---|
| Quadrant | DetID | PixID | Counts | Sigma | Mean | Median | Sigma |
| A | 0 | 13 | 2383944 | 2834.85 | 3945 | 3881 | 839.6 |
| A | 13 | 254 | 121513 | 140.11 | 3945 | 3881 | 839.6 |
| A | 0 | 226 | 24560 | 24.63 | 3945 | 3881 | 839.6 |
| B | 6 | 159 | 18886865 | 25496.95 | 3957 | 3872 | 740.6 |
| B | 0 | 190 | 260084 | 345.95 | 3957 | 3872 | 740.6 |
| B | 10 | 247 | 204619 | 271.06 | 3957 | 3872 | 740.6 |
| C | 3 | 233 | 4246394 | 4908.89 | 3693 | 3680 | 864.3 |
| C | 0 | 10 | 3204205 | 3703.06 | 3693 | 3680 | 864.3 |
| C | 2 | 114 | 132782 | 149.37 | 3693 | 3680 | 864.3 |
| D | 8 | 195 | 34874413 | 36834.01 | 3704 | 3618 | 946.7 |
| D | 13 | 249 | 1765028 | 1860.58 | 3704 | 3618 | 946.7 |
| D | 12 | 227 | 852191 | 896.35 | 3704 | 3618 | 946.7 |
Histogram calculated using DETX and DETY for each event in the final _common_clean file
| Quadrant A | 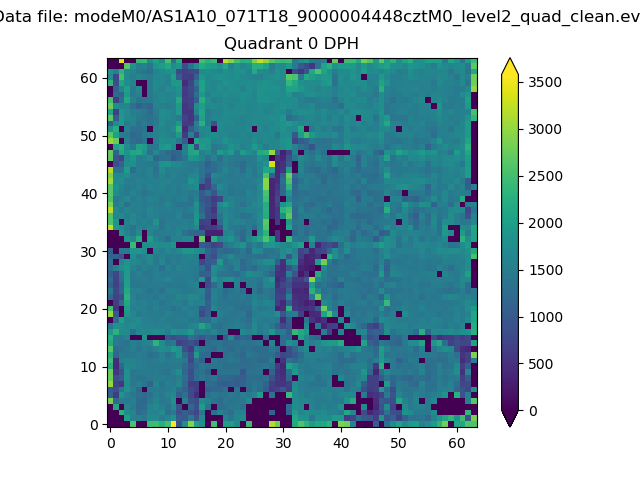 |
 |
Quadrant B |
|---|---|---|---|
| Quadrant D | 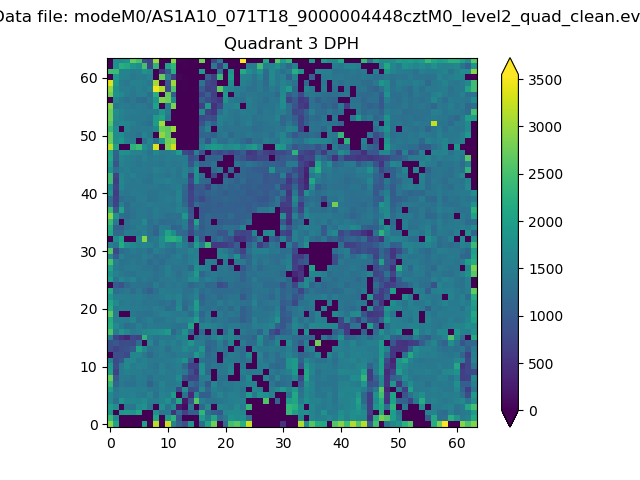 |
 |
Quadrant C |
| Plot type | Count rate plots | Images |
|---|---|---|
| Comparison with Poisson distribution Blue bars denote a histogram of data divided into 1 sec bins. Red curve is a Poisson curve with rate = median count rate of data. |
 |
 |
| Quadrant-wise count rates Data is divided into 100 sec bins |
 |
|
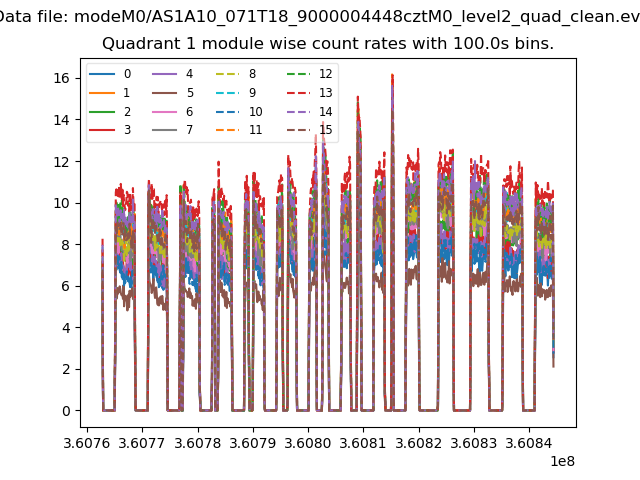
| Module-wise count rates for Quadrant A Data is divided into 100 sec bins |
 |
 |
| Module-wise count rates for Quadrant B Data is divided into 100 sec bins |
 |
 |
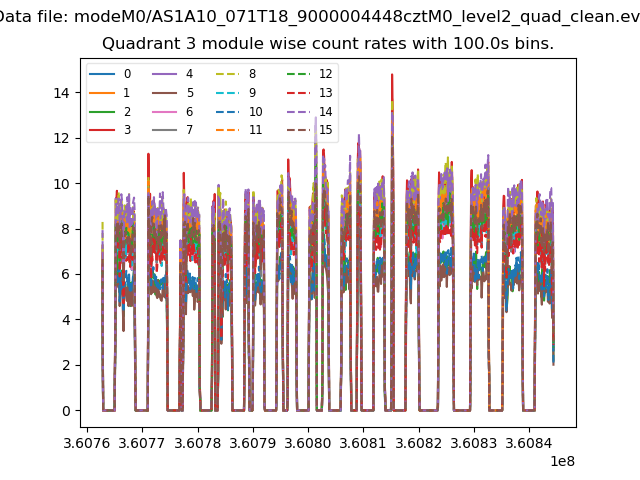
| Module-wise count rates for Quadrant C Data is divided into 100 sec bins |
 |
 |
| Module-wise count rates for Quadrant D Data is divided into 100 sec bins |
 |
 |
| Parameter | Plot |
|---|---|
| CZT HV Monitor |  |
| D_VDD |  |
| Temperature 1 | 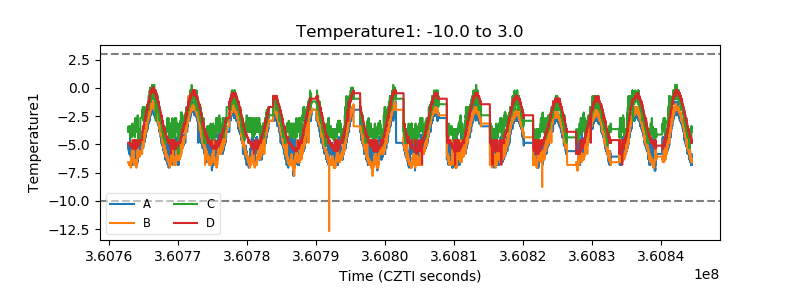 |
| Veto HV Monitor |  |
| Veto LLD | 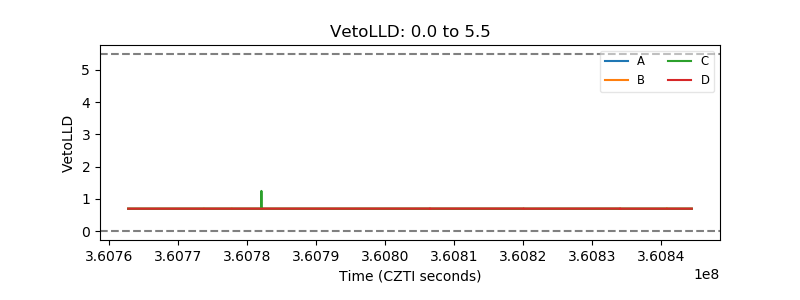 |
| Alpha Counter |  |
| _CPM_Rate |  |
| CZT Counter |  |
| +2.5 Volts monitor |  |
| +5 Volts monitor |  |
| _ROLL_ROT |  |
| _Roll_DEC | 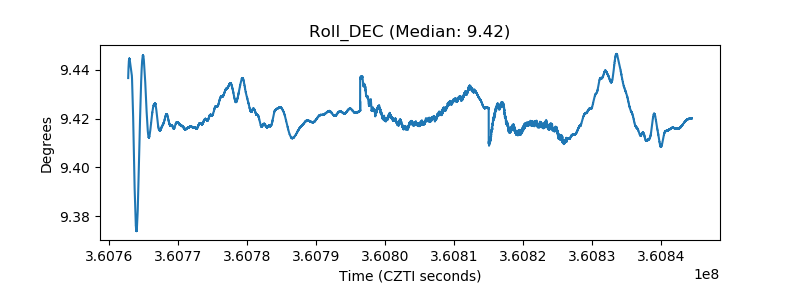 |
| _Roll_RA | 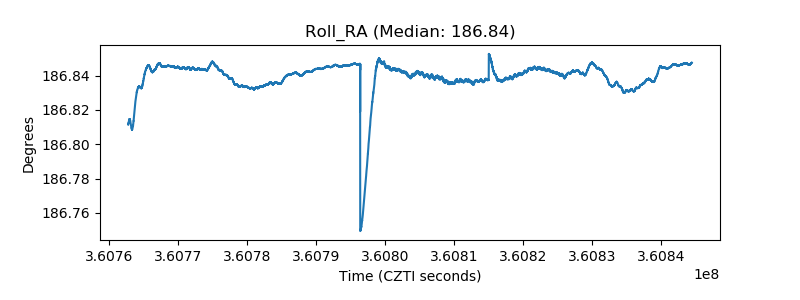 |
| Veto Counter |  |