| Param | Original file | Final file |
|---|---|---|
| Filename | modeM0/AS1A10_053T37_9000004444cztM0_level2_bc.evt | modeM0/AS1A10_053T37_9000004444cztM0_level2_quad_clean.evt |
| Size (bytes) | 1,772,254,080 | 446,120,640 |
| Size | 1.7 GB | 425.5 MB |
| Events in quadrant A | 7,610,643 | 2,838,726 |
| Events in quadrant B | 17,212,731 | 2,860,084 |
| Events in quadrant C | 8,253,247 | 2,783,072 |
| Events in quadrant D | 18,286,640 | 2,697,233 |
| Mode SS | |||
|---|---|---|---|
| Quadrant | BADHDUFLAG | Total packets | Discarded packets |
| A | 0 | 690 | 0 |
| B | 0 | 692 | 0 |
| C | 0 | 692 | 0 |
| D | 0 | 692 | 0 |
| Mode M0 | |||
|---|---|---|---|
| Quadrant | BADHDUFLAG | Total packets | Discarded packets |
| A | 0 | 71316 | 0 |
| B | 0 | 104240 | 0 |
| C | 0 | 74719 | 0 |
| D | 0 | 105425 | 0 |
| Mode M9 | |||
|---|---|---|---|
| Quadrant | BADHDUFLAG | Total packets | Discarded packets |
| A | 0 | 65 | 0 |
| B | 0 | 65 | 0 |
| C | 0 | 65 | 0 |
| D | 0 | 65 | 0 |
| Quadrant | Total seconds | Saturated seconds | Saturation percentage |
|---|---|---|---|
| A | 33979 | 336 | 0.988846% |
| B | 33951 | 729 | 2.147212% |
| C | 33969 | 789 | 2.322706% |
| D | 33946 | 1384 | 4.077064% |
Noise dominated data is calculated using 1-second bins in cleaned event files. If a bin has >2000 counts, and if more than 50% of those come from <1% of pixels, then it is considered to be noise-dominated and hence unusable.
| Quadrant | # 1 sec bins | Bins with >0 counts | Bins with >2000 counts | High rate bins dominated by noise | Noise dominated (total time) | Noise dominated (detector-on time) | Marked lightcurve |
|---|---|---|---|---|---|---|---|
| A | 40551 | 34009 | 13 | 13 | 0.03% | 0.04% |  |
| B | 40551 | 33972 | 1 | 1 | 0.00% | 0.00% |  |
| C | 40551 | 33993 | 12 | 12 | 0.03% | 0.04% | 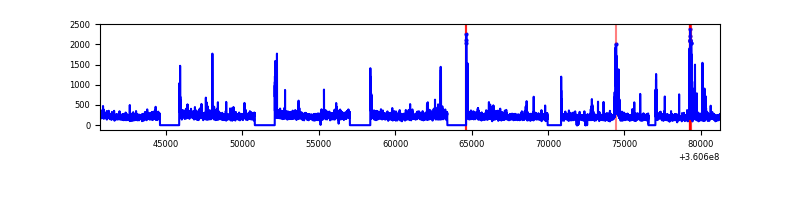 |
| D | 40551 | 33962 | 344 | 344 | 0.85% | 1.01% |  |
Top three noisy pixels from each quadrant. If the there are fewer than three noisy pixels in the level2.evt file, extra rows are filled as -1
| Pixel properties | Quadrant properties | ||||||
|---|---|---|---|---|---|---|---|
| Quadrant | DetID | PixID | Counts | Sigma | Mean | Median | Sigma |
| A | 0 | 13 | 84120 | 199.58 | 1938 | 1909 | 411.9 |
| A | 13 | 254 | 58569 | 137.55 | 1938 | 1909 | 411.9 |
| A | 15 | 192 | 21435 | 47.4 | 1938 | 1909 | 411.9 |
| B | 6 | 159 | 9134232 | 25174.71 | 1948 | 1908 | 362.8 |
| B | 0 | 190 | 147381 | 401.02 | 1948 | 1908 | 362.8 |
| B | 5 | 255 | 105196 | 284.73 | 1948 | 1908 | 362.8 |
| C | 3 | 233 | 695889 | 1580.49 | 1876 | 1873 | 439.1 |
| C | 0 | 10 | 161737 | 364.06 | 1876 | 1873 | 439.1 |
| C | 1 | 16 | 91020 | 203.01 | 1876 | 1873 | 439.1 |
| D | 8 | 195 | 9361459 | 21642.19 | 1912 | 1858 | 432.5 |
| D | 12 | 227 | 497698 | 1146.53 | 1912 | 1858 | 432.5 |
| D | 10 | 253 | 360355 | 828.95 | 1912 | 1858 | 432.5 |
Histogram calculated using DETX and DETY for each event in the final _common_clean file
| Quadrant A |  |
 |
Quadrant B |
|---|---|---|---|
| Quadrant D |  |
 |
Quadrant C |
| Plot type | Count rate plots | Images |
|---|---|---|
| Comparison with Poisson distribution Blue bars denote a histogram of data divided into 1 sec bins. Red curve is a Poisson curve with rate = median count rate of data. |
 |
 |
| Quadrant-wise count rates Data is divided into 100 sec bins |
 |
|
| Module-wise count rates for Quadrant A Data is divided into 100 sec bins |
 |
 |
| Module-wise count rates for Quadrant B Data is divided into 100 sec bins |
 |
 |
| Module-wise count rates for Quadrant C Data is divided into 100 sec bins |
 |
 |
| Module-wise count rates for Quadrant D Data is divided into 100 sec bins |
 |
 |
| Parameter | Plot |
|---|---|
| CZT HV Monitor |  |
| D_VDD |  |
| Temperature 1 |  |
| Veto HV Monitor | 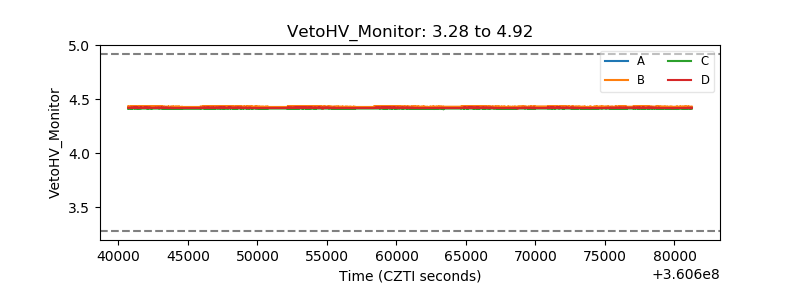 |
| Veto LLD | 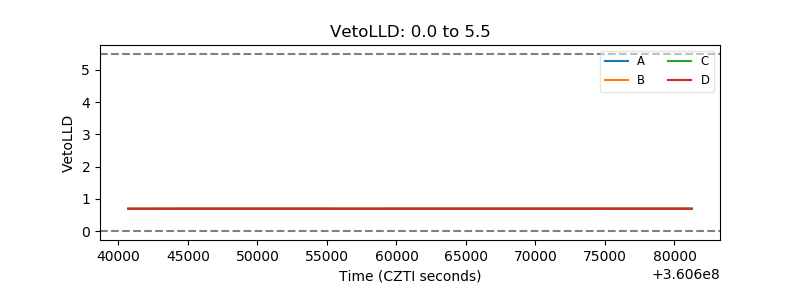 |
| Alpha Counter | 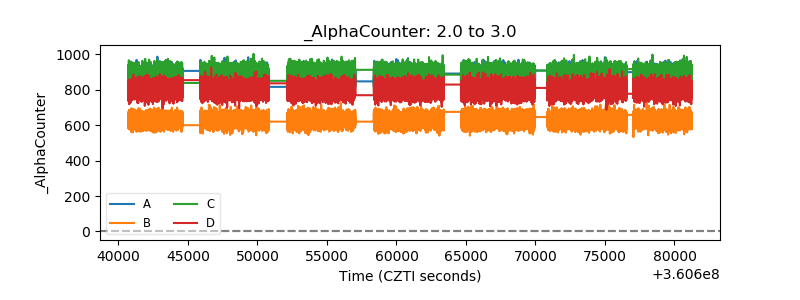 |
| _CPM_Rate |  |
| CZT Counter |  |
| +2.5 Volts monitor |  |
| +5 Volts monitor | 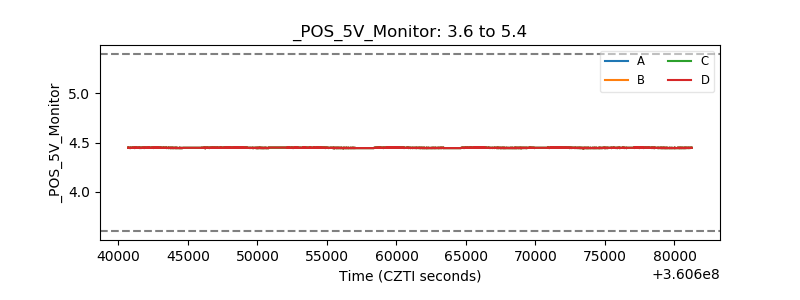 |
| _ROLL_ROT |  |
| _Roll_DEC |  |
| _Roll_RA |  |
| Veto Counter |  |