| Param | Original file | Final file |
|---|---|---|
| Filename | modeM0/AS1A10_071T11_9000004436cztM0_level2_bc.evt | modeM0/AS1A10_071T11_9000004436cztM0_level2_quad_clean.evt |
| Size (bytes) | 4,584,680,640 | 1,028,885,760 |
| Size | 4.3 GB | 981.2 MB |
| Events in quadrant A | 19,631,863 | 6,695,828 |
| Events in quadrant B | 40,636,181 | 6,667,537 |
| Events in quadrant C | 18,956,433 | 6,351,134 |
| Events in quadrant D | 54,204,316 | 5,968,652 |
| Mode SS | |||
|---|---|---|---|
| Quadrant | BADHDUFLAG | Total packets | Discarded packets |
| A | 0 | 1628 | 0 |
| B | 0 | 1628 | 0 |
| C | 0 | 1628 | 0 |
| D | 0 | 1628 | 0 |
| Mode M9 | |||
|---|---|---|---|
| Quadrant | BADHDUFLAG | Total packets | Discarded packets |
| A | 0 | 127 | 0 |
| B | 0 | 127 | 0 |
| C | 0 | 127 | 0 |
| D | 0 | 127 | 0 |
| Mode M0 | |||
|---|---|---|---|
| Quadrant | BADHDUFLAG | Total packets | Discarded packets |
| A | 0 | 175886 | 0 |
| B | 0 | 247505 | 0 |
| C | 0 | 176881 | 0 |
| D | 0 | 286183 | 0 |
| Quadrant | Total seconds | Saturated seconds | Saturation percentage |
|---|---|---|---|
| A | 79929 | 1580 | 1.976754% |
| B | 79929 | 2212 | 2.767456% |
| C | 79929 | 1828 | 2.287030% |
| D | 79929 | 5011 | 6.269314% |
Noise dominated data is calculated using 1-second bins in cleaned event files. If a bin has >2000 counts, and if more than 50% of those come from <1% of pixels, then it is considered to be noise-dominated and hence unusable.
| Quadrant | # 1 sec bins | Bins with >0 counts | Bins with >2000 counts | High rate bins dominated by noise | Noise dominated (total time) | Noise dominated (detector-on time) | Marked lightcurve |
|---|---|---|---|---|---|---|---|
| A | 92659 | 79919 | 30 | 30 | 0.03% | 0.04% |  |
| B | 92659 | 79914 | 38 | 38 | 0.04% | 0.05% |  |
| C | 92659 | 79916 | 4 | 4 | 0.00% | 0.01% |  |
| D | 92659 | 79919 | 1403 | 1403 | 1.51% | 1.76% | 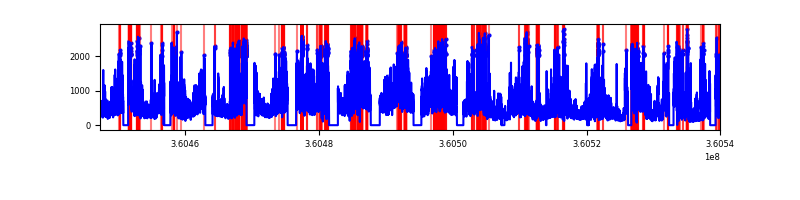 |
Top three noisy pixels from each quadrant. If the there are fewer than three noisy pixels in the level2.evt file, extra rows are filled as -1
| Pixel properties | Quadrant properties | ||||||
|---|---|---|---|---|---|---|---|
| Quadrant | DetID | PixID | Counts | Sigma | Mean | Median | Sigma |
| A | 0 | 13 | 1793057 | 1857.15 | 4534 | 4471 | 963.1 |
| A | 8 | 192 | 305576 | 312.65 | 4534 | 4471 | 963.1 |
| A | 13 | 254 | 138856 | 139.54 | 4534 | 4471 | 963.1 |
| B | 6 | 159 | 21660348 | 25471.87 | 4529 | 4435 | 850.2 |
| B | 5 | 172 | 435348 | 506.84 | 4529 | 4435 | 850.2 |
| B | 5 | 255 | 375397 | 436.33 | 4529 | 4435 | 850.2 |
| C | 3 | 233 | 1889781 | 1900.61 | 4272 | 4261 | 992.1 |
| C | 2 | 114 | 152828 | 149.76 | 4272 | 4261 | 992.1 |
| C | 10 | 22 | 128449 | 125.18 | 4272 | 4261 | 992.1 |
| D | 8 | 195 | 29958760 | 29302.64 | 4289 | 4165 | 1022.2 |
| D | 10 | 253 | 4377057 | 4277.72 | 4289 | 4165 | 1022.2 |
| D | 13 | 249 | 1312169 | 1279.54 | 4289 | 4165 | 1022.2 |
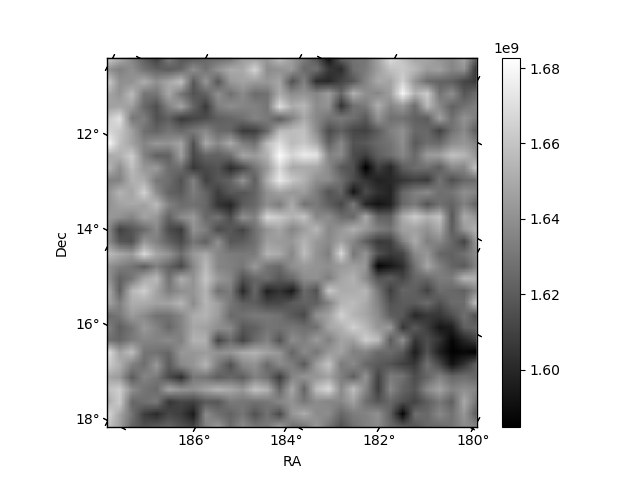
Histogram calculated using DETX and DETY for each event in the final _common_clean file
| Quadrant A |  |
 |
Quadrant B |
|---|---|---|---|
| Quadrant D |  |
 |
Quadrant C |
| Plot type | Count rate plots | Images |
|---|---|---|
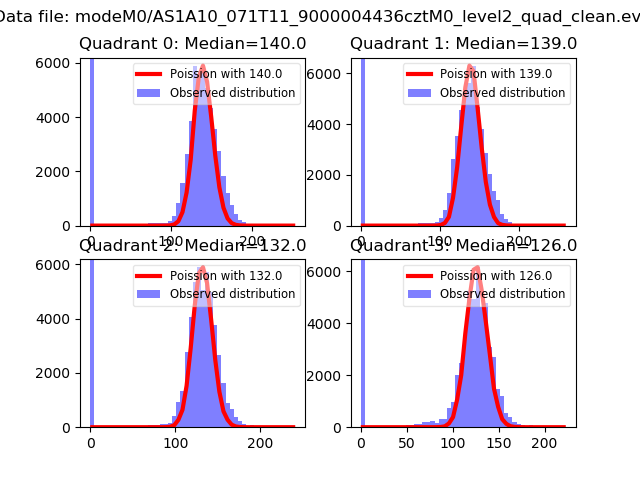
| Comparison with Poisson distribution Blue bars denote a histogram of data divided into 1 sec bins. Red curve is a Poisson curve with rate = median count rate of data. |
 |
 |
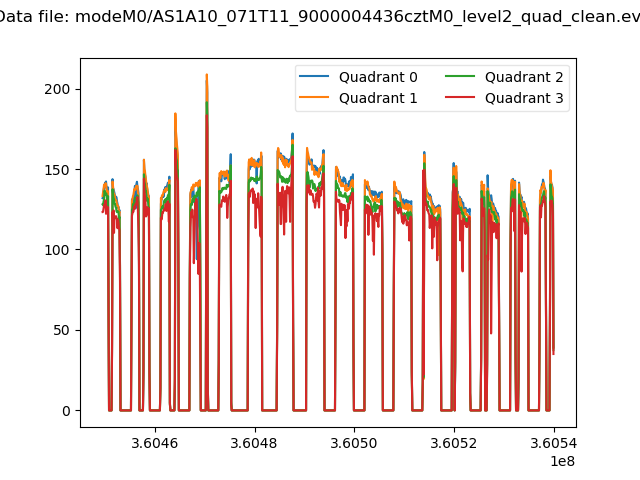
| Quadrant-wise count rates Data is divided into 100 sec bins |
 |
|
| Module-wise count rates for Quadrant A Data is divided into 100 sec bins |
 |
 |
| Module-wise count rates for Quadrant B Data is divided into 100 sec bins |
 |
 |
| Module-wise count rates for Quadrant C Data is divided into 100 sec bins |
 |
 |
| Module-wise count rates for Quadrant D Data is divided into 100 sec bins |
 |
 |
| Parameter | Plot |
|---|---|
| CZT HV Monitor |  |
| D_VDD |  |
| Temperature 1 | 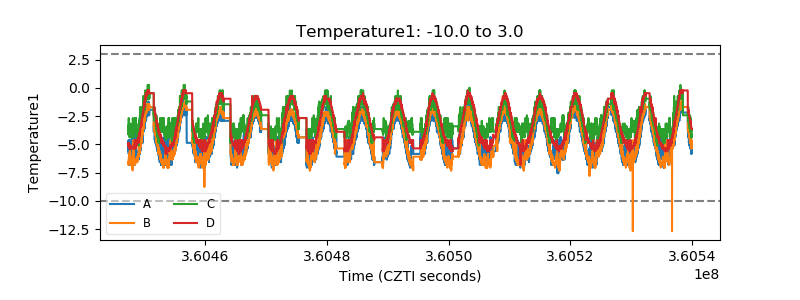 |
| Veto HV Monitor |  |
| Veto LLD |  |
| Alpha Counter |  |
| _CPM_Rate |  |
| CZT Counter |  |
| +2.5 Volts monitor | 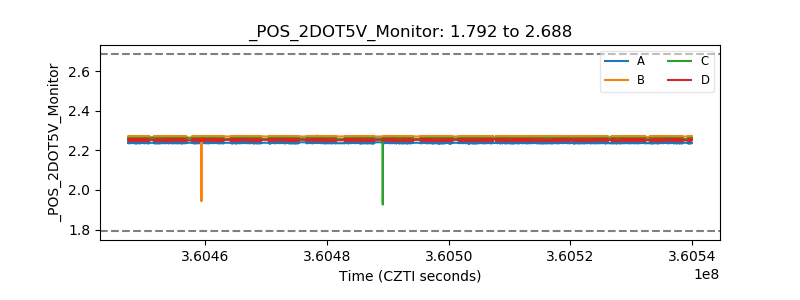 |
| +5 Volts monitor | 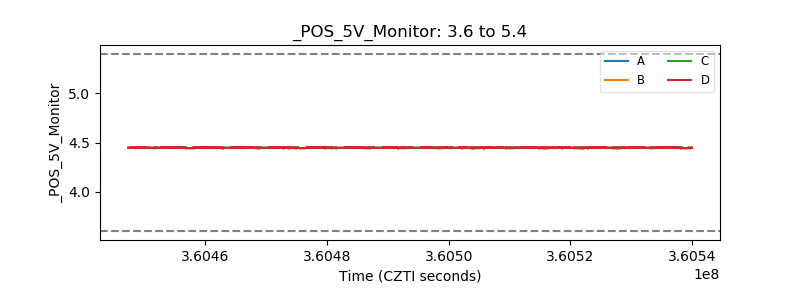 |
| _ROLL_ROT |  |
| _Roll_DEC |  |
| _Roll_RA |  |
| Veto Counter |  |