| Param | Original file | Final file |
|---|---|---|
| Filename | modeM0/AS1C05_008T01_9000004432cztM0_level2_bc.evt | modeM0/AS1C05_008T01_9000004432cztM0_level2_quad_clean.evt |
| Size (bytes) | 718,922,880 | 155,004,480 |
| Size | 685.6 MB | 147.8 MB |
| Events in quadrant A | 2,579,709 | 1,015,941 |
| Events in quadrant B | 5,498,740 | 1,008,247 |
| Events in quadrant C | 3,070,995 | 975,143 |
| Events in quadrant D | 9,870,607 | 933,186 |
| Mode M0 | |||
|---|---|---|---|
| Quadrant | BADHDUFLAG | Total packets | Discarded packets |
| A | 0 | 23756 | 0 |
| B | 0 | 33864 | 0 |
| C | 0 | 25753 | 0 |
| D | 0 | 46222 | 0 |
| Mode M9 | |||
|---|---|---|---|
| Quadrant | BADHDUFLAG | Total packets | Discarded packets |
| A | 0 | 15 | 0 |
| B | 0 | 15 | 0 |
| C | 0 | 15 | 0 |
| D | 0 | 15 | 0 |
| Mode SS | |||
|---|---|---|---|
| Quadrant | BADHDUFLAG | Total packets | Discarded packets |
| A | 0 | 224 | 0 |
| B | 0 | 224 | 0 |
| C | 0 | 224 | 0 |
| D | 0 | 224 | 0 |
| Quadrant | Total seconds | Saturated seconds | Saturation percentage |
|---|---|---|---|
| A | 11010 | 100 | 0.908265% |
| B | 11010 | 243 | 2.207084% |
| C | 11010 | 312 | 2.833787% |
| D | 11010 | 1157 | 10.508629% |
Noise dominated data is calculated using 1-second bins in cleaned event files. If a bin has >2000 counts, and if more than 50% of those come from <1% of pixels, then it is considered to be noise-dominated and hence unusable.
| Quadrant | # 1 sec bins | Bins with >0 counts | Bins with >2000 counts | High rate bins dominated by noise | Noise dominated (total time) | Noise dominated (detector-on time) | Marked lightcurve |
|---|---|---|---|---|---|---|---|
| A | 12515 | 11008 | 2 | 2 | 0.02% | 0.02% |  |
| B | 12515 | 11008 | 2 | 2 | 0.02% | 0.02% |  |
| C | 12515 | 11008 | 35 | 35 | 0.28% | 0.32% |  |
| D | 12515 | 11009 | 223 | 223 | 1.78% | 2.03% |  |
Top three noisy pixels from each quadrant. If the there are fewer than three noisy pixels in the level2.evt file, extra rows are filled as -1
| Pixel properties | Quadrant properties | ||||||
|---|---|---|---|---|---|---|---|
| Quadrant | DetID | PixID | Counts | Sigma | Mean | Median | Sigma |
| A | 0 | 13 | 341802 | 2711.72 | 572 | 560 | 125.8 |
| A | 8 | 192 | 23030 | 178.56 | 572 | 560 | 125.8 |
| A | 13 | 254 | 18918 | 145.88 | 572 | 560 | 125.8 |
| B | 6 | 159 | 3092465 | 27799.58 | 570 | 556 | 111.2 |
| B | 6 | 36 | 64713 | 576.84 | 570 | 556 | 111.2 |
| B | 5 | 172 | 45604 | 405.03 | 570 | 556 | 111.2 |
| C | 10 | 22 | 643242 | 4908.89 | 545 | 542 | 130.9 |
| C | 3 | 233 | 242373 | 1847.08 | 545 | 542 | 130.9 |
| C | 0 | 10 | 39950 | 300.99 | 545 | 542 | 130.9 |
| D | 8 | 195 | 6432651 | 51440.93 | 542 | 524 | 125.0 |
| D | 1 | 52 | 1001899 | 8008.5 | 542 | 524 | 125.0 |
| D | 10 | 253 | 164764 | 1313.51 | 542 | 524 | 125.0 |
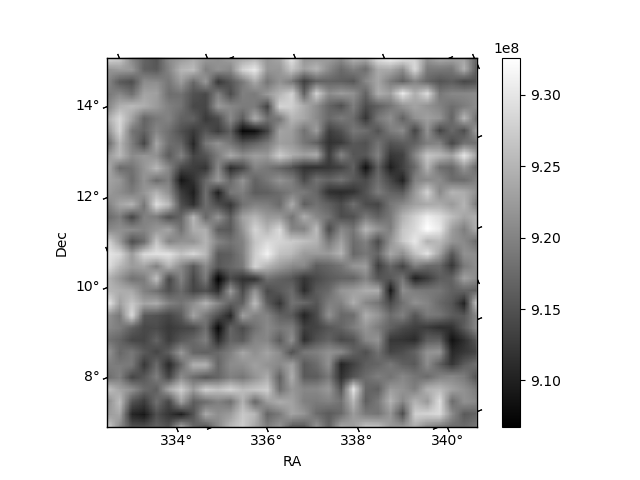
Histogram calculated using DETX and DETY for each event in the final _common_clean file
| Quadrant A |  |
 |
Quadrant B |
|---|---|---|---|
| Quadrant D |  |
 |
Quadrant C |
| Plot type | Count rate plots | Images |
|---|---|---|
| Comparison with Poisson distribution Blue bars denote a histogram of data divided into 1 sec bins. Red curve is a Poisson curve with rate = median count rate of data. |
 |
 |
| Quadrant-wise count rates Data is divided into 100 sec bins |
 |
|
| Module-wise count rates for Quadrant A Data is divided into 100 sec bins |
 |
 |
| Module-wise count rates for Quadrant B Data is divided into 100 sec bins |
 |
 |
| Module-wise count rates for Quadrant C Data is divided into 100 sec bins |
 |
 |
| Module-wise count rates for Quadrant D Data is divided into 100 sec bins |
 |
 |
| Parameter | Plot |
|---|---|
| CZT HV Monitor |  |
| D_VDD |  |
| Temperature 1 |  |
| Veto HV Monitor | 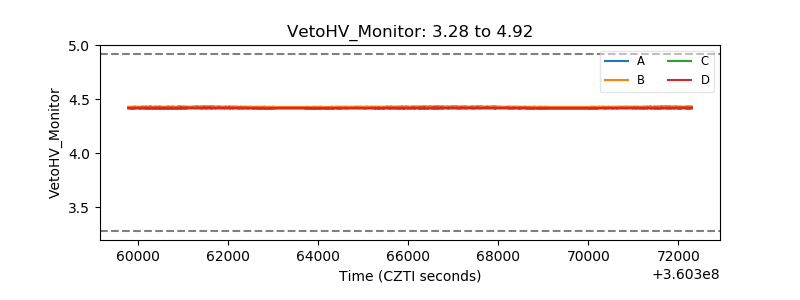 |
| Veto LLD |  |
| Alpha Counter |  |
| _CPM_Rate |  |
| CZT Counter |  |
| +2.5 Volts monitor |  |
| +5 Volts monitor |  |
| _ROLL_ROT |  |
| _Roll_DEC |  |
| _Roll_RA |  |
| Veto Counter |  |