| Param | Original file | Final file |
|---|---|---|
| Filename | modeM0/AS1A10_071T44_9000004434cztM0_level2_bc.evt | modeM0/AS1A10_071T44_9000004434cztM0_level2_quad_clean.evt |
| Size (bytes) | 3,912,816,960 | 864,025,920 |
| Size | 3.6 GB | 824.0 MB |
| Events in quadrant A | 17,948,535 | 5,707,932 |
| Events in quadrant B | 33,684,399 | 5,655,532 |
| Events in quadrant C | 19,220,215 | 5,360,401 |
| Events in quadrant D | 43,372,378 | 5,119,673 |
| Mode SS | |||
|---|---|---|---|
| Quadrant | BADHDUFLAG | Total packets | Discarded packets |
| A | 0 | 1282 | 0 |
| B | 0 | 1282 | 0 |
| C | 0 | 1282 | 0 |
| D | 0 | 1282 | 0 |
| Mode M0 | |||
|---|---|---|---|
| Quadrant | BADHDUFLAG | Total packets | Discarded packets |
| A | 0 | 148167 | 0 |
| B | 0 | 200248 | 0 |
| C | 0 | 158484 | 0 |
| D | 0 | 229514 | 0 |
| Mode M9 | |||
|---|---|---|---|
| Quadrant | BADHDUFLAG | Total packets | Discarded packets |
| A | 0 | 102 | 0 |
| B | 0 | 102 | 0 |
| C | 0 | 102 | 0 |
| D | 0 | 102 | 0 |
| Quadrant | Total seconds | Saturated seconds | Saturation percentage |
|---|---|---|---|
| A | 63069 | 1760 | 2.790594% |
| B | 63067 | 2617 | 4.149555% |
| C | 63068 | 3072 | 4.870933% |
| D | 63069 | 4313 | 6.838542% |
Noise dominated data is calculated using 1-second bins in cleaned event files. If a bin has >2000 counts, and if more than 50% of those come from <1% of pixels, then it is considered to be noise-dominated and hence unusable.
| Quadrant | # 1 sec bins | Bins with >0 counts | Bins with >2000 counts | High rate bins dominated by noise | Noise dominated (total time) | Noise dominated (detector-on time) | Marked lightcurve |
|---|---|---|---|---|---|---|---|
| A | 73244 | 63060 | 35 | 35 | 0.05% | 0.06% |  |
| B | 73244 | 63061 | 60 | 60 | 0.08% | 0.10% |  |
| C | 73244 | 63060 | 33 | 33 | 0.05% | 0.05% |  |
| D | 73244 | 63059 | 1236 | 1236 | 1.69% | 1.96% |  |
Top three noisy pixels from each quadrant. If the there are fewer than three noisy pixels in the level2.evt file, extra rows are filled as -1
| Pixel properties | Quadrant properties | ||||||
|---|---|---|---|---|---|---|---|
| Quadrant | DetID | PixID | Counts | Sigma | Mean | Median | Sigma |
| A | 0 | 13 | 2419687 | 3115.09 | 3668 | 3613 | 775.6 |
| A | 8 | 192 | 1348856 | 1734.45 | 3668 | 3613 | 775.6 |
| A | 13 | 254 | 113176 | 141.26 | 3668 | 3613 | 775.6 |
| B | 6 | 159 | 16900861 | 24844.57 | 3657 | 3582 | 680.1 |
| B | 6 | 36 | 1254701 | 1839.56 | 3657 | 3582 | 680.1 |
| B | 5 | 255 | 766766 | 1122.13 | 3657 | 3582 | 680.1 |
| C | 3 | 233 | 2927659 | 3693.27 | 3428 | 3428 | 791.8 |
| C | 10 | 22 | 2741484 | 3458.13 | 3428 | 3428 | 791.8 |
| C | 0 | 10 | 129615 | 159.37 | 3428 | 3428 | 791.8 |
| D | 8 | 195 | 23184077 | 27285.29 | 3463 | 3385 | 849.6 |
| D | 10 | 253 | 3347639 | 3936.42 | 3463 | 3385 | 849.6 |
| D | 13 | 249 | 1072578 | 1258.51 | 3463 | 3385 | 849.6 |
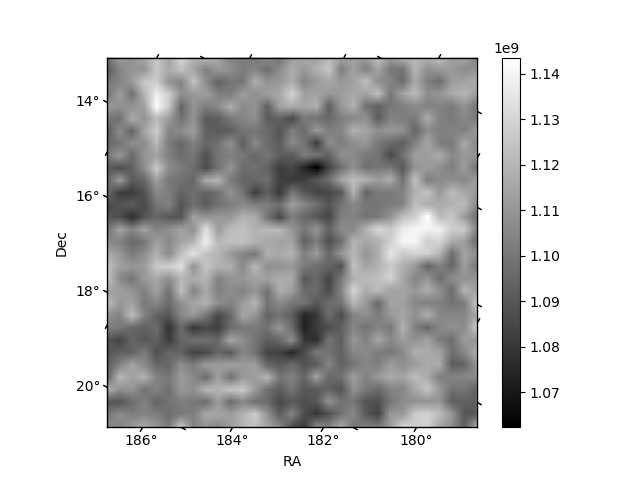
Histogram calculated using DETX and DETY for each event in the final _common_clean file
| Quadrant A |  |
 |
Quadrant B |
|---|---|---|---|
| Quadrant D |  |
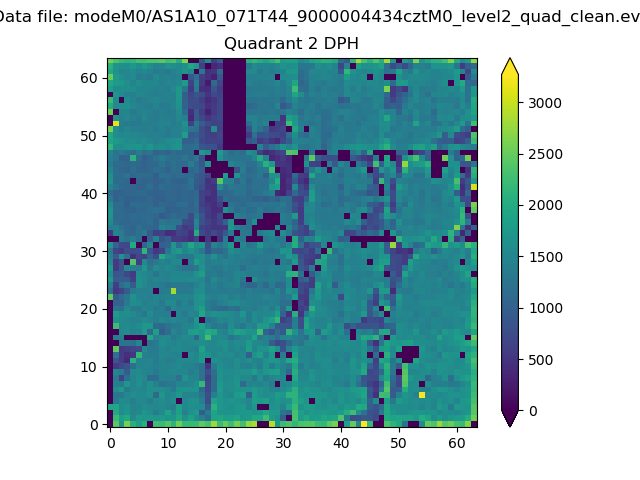 |
Quadrant C |
| Plot type | Count rate plots | Images |
|---|---|---|
| Comparison with Poisson distribution Blue bars denote a histogram of data divided into 1 sec bins. Red curve is a Poisson curve with rate = median count rate of data. |
 |
 |
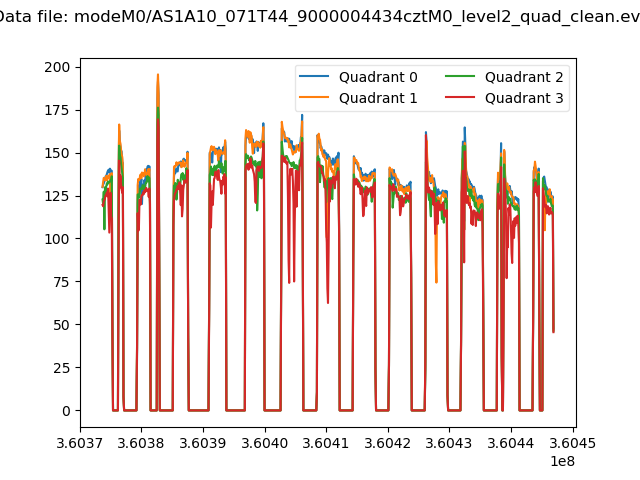
| Quadrant-wise count rates Data is divided into 100 sec bins |
 |
|
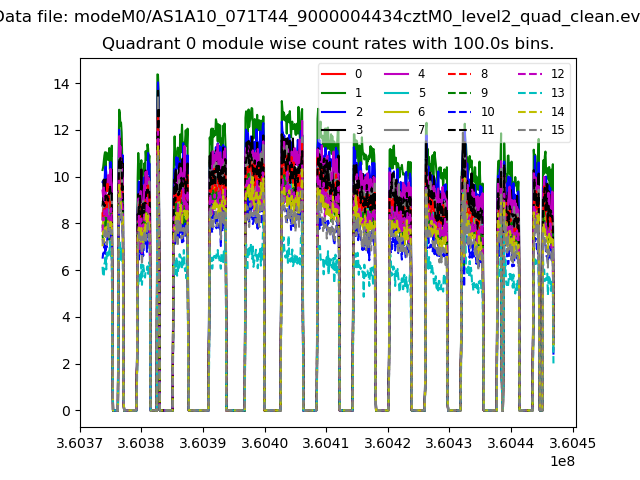
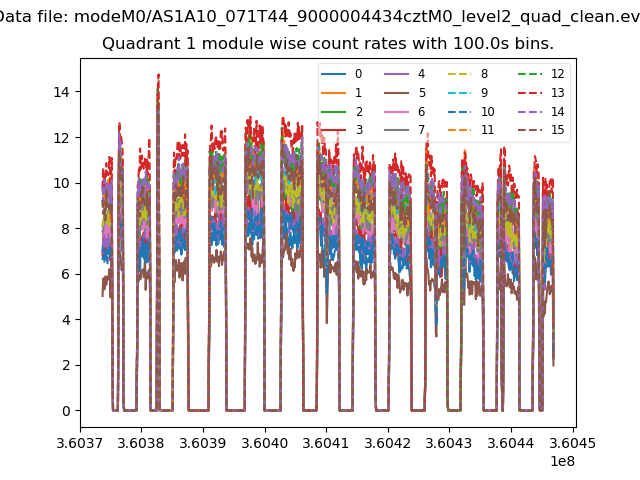
| Module-wise count rates for Quadrant A Data is divided into 100 sec bins |
 |
 |
| Module-wise count rates for Quadrant B Data is divided into 100 sec bins |
 |
 |
| Module-wise count rates for Quadrant C Data is divided into 100 sec bins |
 |
 |
| Module-wise count rates for Quadrant D Data is divided into 100 sec bins |
 |
 |
| Parameter | Plot |
|---|---|
| CZT HV Monitor |  |
| D_VDD |  |
| Temperature 1 |  |
| Veto HV Monitor |  |
| Veto LLD |  |
| Alpha Counter | 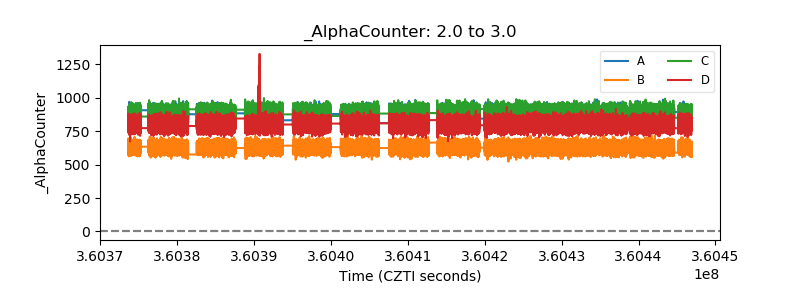 |
| _CPM_Rate |  |
| CZT Counter | 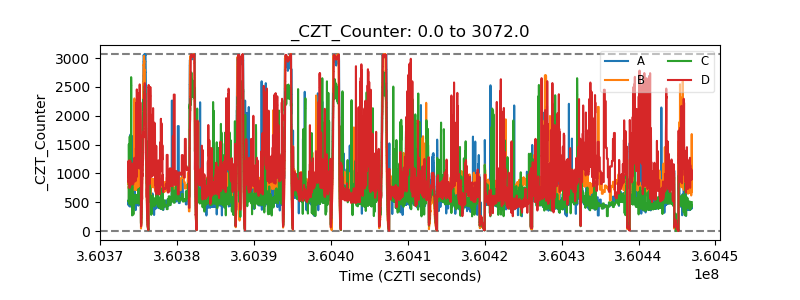 |
| +2.5 Volts monitor |  |
| +5 Volts monitor |  |
| _ROLL_ROT | 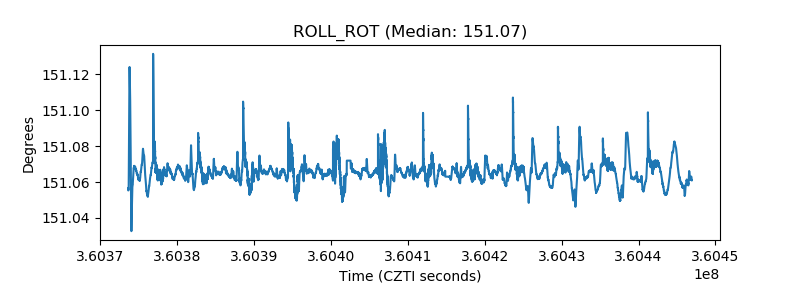 |
| _Roll_DEC | 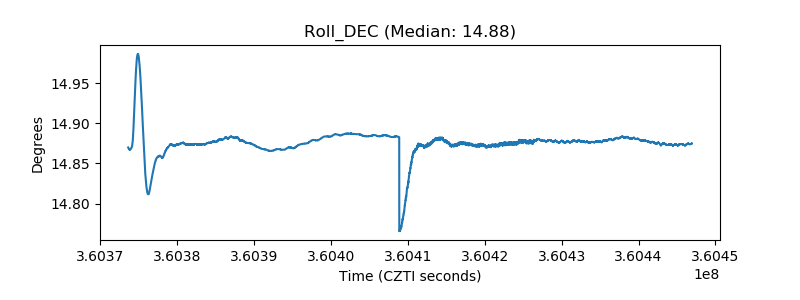 |
| _Roll_RA |  |
| Veto Counter | 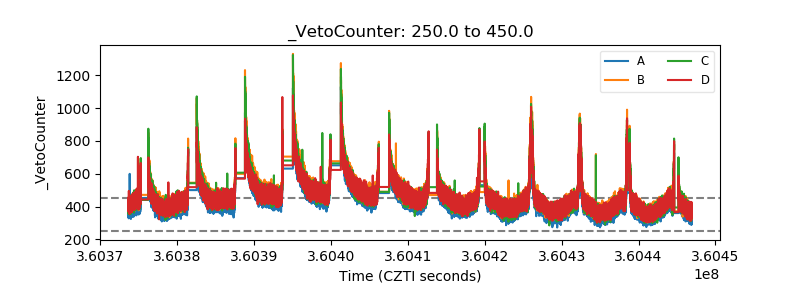 |