| Param | Original file | Final file |
|---|---|---|
| Filename | modeM0/AS1A10_094T82_9000004428cztM0_level2_bc.evt | modeM0/AS1A10_094T82_9000004428cztM0_level2_quad_clean.evt |
| Size (bytes) | 279,357,120 | 96,670,080 |
| Size | 266.4 MB | 92.2 MB |
| Events in quadrant A | 1,179,091 | 692,213 |
| Events in quadrant B | 2,196,504 | 674,908 |
| Events in quadrant C | 1,159,977 | 660,849 |
| Events in quadrant D | 3,634,918 | 606,534 |
| Mode M0 | |||
|---|---|---|---|
| Quadrant | BADHDUFLAG | Total packets | Discarded packets |
| A | 0 | 9815 | 0 |
| B | 0 | 13016 | 0 |
| C | 0 | 10278 | 0 |
| D | 0 | 17777 | 0 |
| Mode SS | |||
|---|---|---|---|
| Quadrant | BADHDUFLAG | Total packets | Discarded packets |
| A | 0 | 80 | 0 |
| B | 0 | 76 | 0 |
| C | 0 | 72 | 0 |
| D | 0 | 79 | 0 |
| Mode M9 | |||
|---|---|---|---|
| Quadrant | BADHDUFLAG | Total packets | Discarded packets |
| A | 0 | 18 | 0 |
| B | 0 | 18 | 0 |
| C | 0 | 18 | 0 |
| D | 0 | 18 | 0 |
| Quadrant | Total seconds | Saturated seconds | Saturation percentage |
|---|---|---|---|
| A | 4209 | 84 | 1.995723% |
| B | 4161 | 132 | 3.172314% |
| C | 4213 | 220 | 5.221932% |
| D | 4125 | 570 | 13.818182% |
Noise dominated data is calculated using 1-second bins in cleaned event files. If a bin has >2000 counts, and if more than 50% of those come from <1% of pixels, then it is considered to be noise-dominated and hence unusable.
| Quadrant | # 1 sec bins | Bins with >0 counts | Bins with >2000 counts | High rate bins dominated by noise | Noise dominated (total time) | Noise dominated (detector-on time) | Marked lightcurve |
|---|---|---|---|---|---|---|---|
| A | 22098 | 4634 | 0 | 0 | 0.00% | 0.00% |  |
| B | 22098 | 4589 | 0 | 0 | 0.00% | 0.00% |  |
| C | 22100 | 4636 | 0 | 0 | 0.00% | 0.00% |  |
| D | 22098 | 4554 | 200 | 200 | 0.91% | 4.39% |  |
Top three noisy pixels from each quadrant. If the there are fewer than three noisy pixels in the level2.evt file, extra rows are filled as -1
| Pixel properties | Quadrant properties | ||||||
|---|---|---|---|---|---|---|---|
| Quadrant | DetID | PixID | Counts | Sigma | Mean | Median | Sigma |
| A | 0 | 13 | 75002 | 1216.68 | 281 | 277 | 61.4 |
| A | 8 | 192 | 20504 | 329.34 | 281 | 277 | 61.4 |
| A | 13 | 254 | 7454 | 116.86 | 281 | 277 | 61.4 |
| B | 6 | 159 | 1097532 | 20797.35 | 273 | 269 | 52.8 |
| B | 0 | 190 | 21818 | 408.44 | 273 | 269 | 52.8 |
| B | 4 | 80 | 6914 | 125.95 | 273 | 269 | 52.8 |
| C | 3 | 233 | 61821 | 963.06 | 265 | 265 | 63.9 |
| C | 0 | 10 | 43120 | 670.48 | 265 | 265 | 63.9 |
| C | 10 | 22 | 9873 | 150.32 | 265 | 265 | 63.9 |
| D | 8 | 195 | 1604467 | 26712.21 | 260 | 254 | 60.1 |
| D | 12 | 227 | 611930 | 10185.19 | 260 | 254 | 60.1 |
| D | 1 | 52 | 156249 | 2597.52 | 260 | 254 | 60.1 |
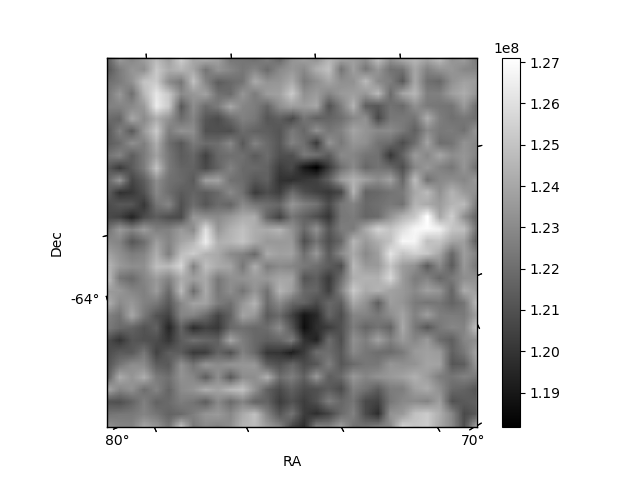
Histogram calculated using DETX and DETY for each event in the final _common_clean file
| Quadrant A |  |
 |
Quadrant B |
|---|---|---|---|
| Quadrant D |  |
 |
Quadrant C |
| Plot type | Count rate plots | Images |
|---|---|---|
| Comparison with Poisson distribution Blue bars denote a histogram of data divided into 1 sec bins. Red curve is a Poisson curve with rate = median count rate of data. |
 |
 |
| Quadrant-wise count rates Data is divided into 100 sec bins |
 |
|
| Module-wise count rates for Quadrant A Data is divided into 100 sec bins |
 |
 |
| Module-wise count rates for Quadrant B Data is divided into 100 sec bins |
 |
 |
| Module-wise count rates for Quadrant C Data is divided into 100 sec bins |
 |
 |
| Module-wise count rates for Quadrant D Data is divided into 100 sec bins |
 |
 |
| Parameter | Plot |
|---|---|
| CZT HV Monitor | 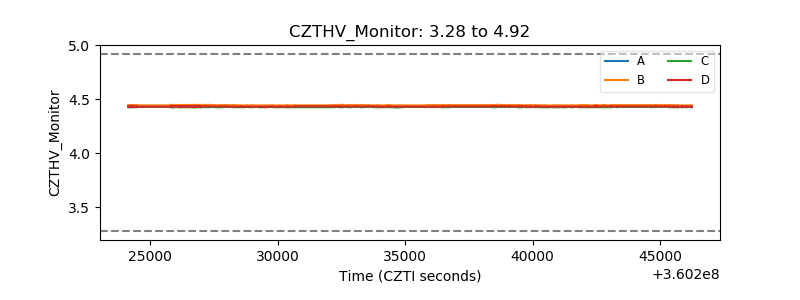 |
| D_VDD | 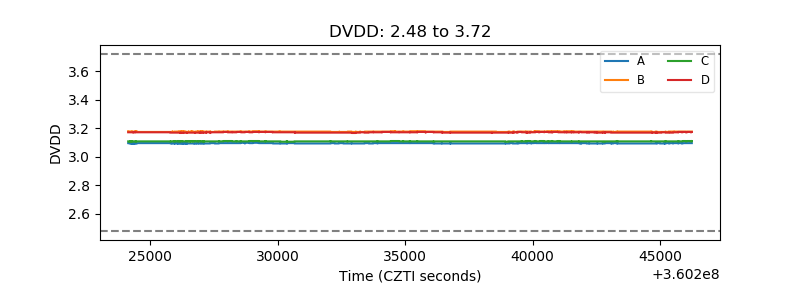 |
| Temperature 1 |  |
| Veto HV Monitor |  |
| Veto LLD | 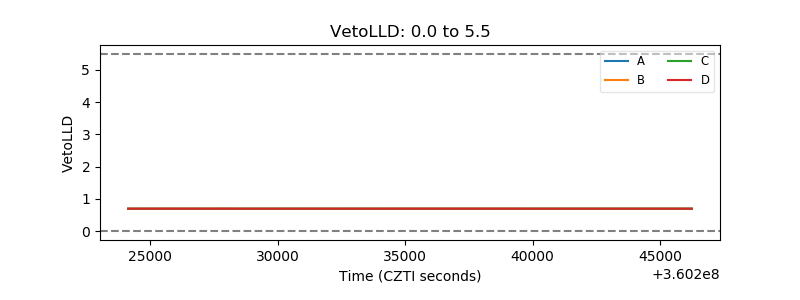 |
| Alpha Counter |  |
| _CPM_Rate |  |
| CZT Counter |  |
| +2.5 Volts monitor |  |
| +5 Volts monitor |  |
| _ROLL_ROT |  |
| _Roll_DEC |  |
| _Roll_RA |  |
| Veto Counter |  |