| Param | Original file | Final file |
|---|---|---|
| Filename | modeM0/AS1A10_058T14_9000004430cztM0_level2_bc.evt | modeM0/AS1A10_058T14_9000004430cztM0_level2_quad_clean.evt |
| Size (bytes) | 5,474,424,960 | 1,016,524,800 |
| Size | 5.1 GB | 969.4 MB |
| Events in quadrant A | 20,886,417 | 6,688,014 |
| Events in quadrant B | 39,854,993 | 6,660,809 |
| Events in quadrant C | 18,758,558 | 6,433,516 |
| Events in quadrant D | 81,061,327 | 5,700,969 |
| Mode M9 | |||
|---|---|---|---|
| Quadrant | BADHDUFLAG | Total packets | Discarded packets |
| A | 0 | 122 | 0 |
| B | 0 | 123 | 0 |
| C | 0 | 122 | 0 |
| D | 0 | 122 | 0 |
| Mode SS | |||
|---|---|---|---|
| Quadrant | BADHDUFLAG | Total packets | Discarded packets |
| A | 0 | 1572 | 0 |
| B | 0 | 1580 | 0 |
| C | 0 | 1576 | 0 |
| D | 0 | 1576 | 0 |
| Mode M0 | |||
|---|---|---|---|
| Quadrant | BADHDUFLAG | Total packets | Discarded packets |
| A | 0 | 177051 | 0 |
| B | 0 | 238985 | 0 |
| C | 0 | 172801 | 0 |
| D | 0 | 368231 | 0 |
| Quadrant | Total seconds | Saturated seconds | Saturation percentage |
|---|---|---|---|
| A | 77454 | 1932 | 2.494384% |
| B | 77354 | 1933 | 2.498901% |
| C | 77455 | 2176 | 2.809373% |
| D | 77092 | 11308 | 14.668189% |
Noise dominated data is calculated using 1-second bins in cleaned event files. If a bin has >2000 counts, and if more than 50% of those come from <1% of pixels, then it is considered to be noise-dominated and hence unusable.
| Quadrant | # 1 sec bins | Bins with >0 counts | Bins with >2000 counts | High rate bins dominated by noise | Noise dominated (total time) | Noise dominated (detector-on time) | Marked lightcurve |
|---|---|---|---|---|---|---|---|
| A | 90452 | 77664 | 67 | 67 | 0.07% | 0.09% |  |
| B | 90452 | 77617 | 25 | 25 | 0.03% | 0.03% |  |
| C | 90452 | 77673 | 24 | 24 | 0.03% | 0.03% |  |
| D | 90451 | 77341 | 3955 | 3955 | 4.37% | 5.11% |  |
Top three noisy pixels from each quadrant. If the there are fewer than three noisy pixels in the level2.evt file, extra rows are filled as -1
| Pixel properties | Quadrant properties | ||||||
|---|---|---|---|---|---|---|---|
| Quadrant | DetID | PixID | Counts | Sigma | Mean | Median | Sigma |
| A | 0 | 13 | 3848139 | 4133.31 | 4374 | 4316 | 930.0 |
| A | 13 | 254 | 144496 | 150.74 | 4374 | 4316 | 930.0 |
| A | 8 | 192 | 132211 | 137.53 | 4374 | 4316 | 930.0 |
| B | 6 | 159 | 21141978 | 25721.9 | 4377 | 4290 | 821.8 |
| B | 0 | 190 | 691604 | 836.37 | 4377 | 4290 | 821.8 |
| B | 5 | 172 | 252936 | 302.57 | 4377 | 4290 | 821.8 |
| C | 3 | 233 | 1279293 | 1324.11 | 4169 | 4175 | 963.0 |
| C | 10 | 22 | 934391 | 965.96 | 4169 | 4175 | 963.0 |
| C | 0 | 10 | 189377 | 192.32 | 4169 | 4175 | 963.0 |
| D | 8 | 195 | 56455088 | 60933.24 | 4046 | 3926 | 926.4 |
| D | 12 | 218 | 4134225 | 4458.23 | 4046 | 3926 | 926.4 |
| D | 1 | 52 | 1702205 | 1833.12 | 4046 | 3926 | 926.4 |
Histogram calculated using DETX and DETY for each event in the final _common_clean file
| Quadrant A |  |
 |
Quadrant B |
|---|---|---|---|
| Quadrant D |  |
 |
Quadrant C |
| Plot type | Count rate plots | Images |
|---|---|---|
| Comparison with Poisson distribution Blue bars denote a histogram of data divided into 1 sec bins. Red curve is a Poisson curve with rate = median count rate of data. |
 |
 |
| Quadrant-wise count rates Data is divided into 100 sec bins |
 |
|
| Module-wise count rates for Quadrant A Data is divided into 100 sec bins |
 |
 |
| Module-wise count rates for Quadrant B Data is divided into 100 sec bins |
 |
 |
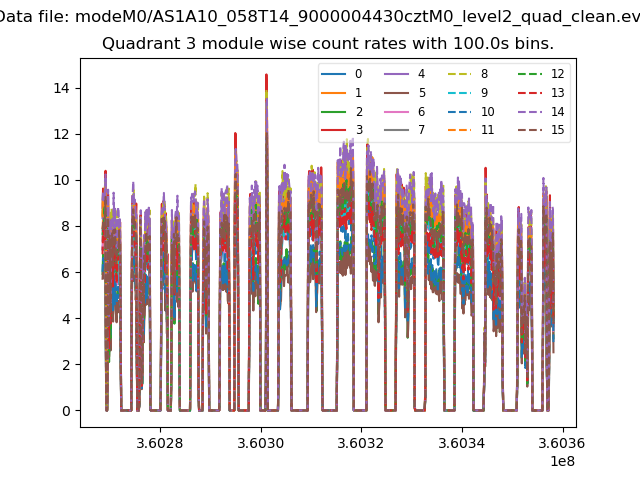
| Module-wise count rates for Quadrant C Data is divided into 100 sec bins |
 |
 |
| Module-wise count rates for Quadrant D Data is divided into 100 sec bins |
 |
 |
| Parameter | Plot |
|---|---|
| CZT HV Monitor |  |
| D_VDD |  |
| Temperature 1 |  |
| Veto HV Monitor |  |
| Veto LLD |  |
| Alpha Counter |  |
| _CPM_Rate |  |
| CZT Counter |  |
| +2.5 Volts monitor |  |
| +5 Volts monitor |  |
| _ROLL_ROT |  |
| _Roll_DEC |  |
| _Roll_RA |  |
| Veto Counter |  |