| Param | Original file | Final file |
|---|---|---|
| Filename | modeM0/AS1A10_094T81_9000004426cztM0_level2_bc.evt | modeM0/AS1A10_094T81_9000004426cztM0_level2_quad_clean.evt |
| Size (bytes) | 3,639,398,400 | 889,591,680 |
| Size | 3.4 GB | 848.4 MB |
| Events in quadrant A | 11,558,222 | 6,295,783 |
| Events in quadrant B | 23,093,105 | 6,244,383 |
| Events in quadrant C | 11,668,809 | 6,072,212 |
| Events in quadrant D | 60,736,639 | 5,124,387 |
| Mode M9 | |||
|---|---|---|---|
| Quadrant | BADHDUFLAG | Total packets | Discarded packets |
| A | 0 | 57 | 0 |
| B | 0 | 57 | 0 |
| C | 0 | 57 | 0 |
| D | 0 | 57 | 0 |
| Mode M0 | |||
|---|---|---|---|
| Quadrant | BADHDUFLAG | Total packets | Discarded packets |
| A | 0 | 102026 | 0 |
| B | 0 | 141792 | 0 |
| C | 0 | 103729 | 0 |
| D | 0 | 259750 | 0 |
| Mode SS | |||
|---|---|---|---|
| Quadrant | BADHDUFLAG | Total packets | Discarded packets |
| A | 0 | 948 | 0 |
| B | 0 | 948 | 0 |
| C | 0 | 948 | 0 |
| D | 0 | 948 | 0 |
| Quadrant | Total seconds | Saturated seconds | Saturation percentage |
|---|---|---|---|
| A | 46689 | 849 | 1.818415% |
| B | 46689 | 847 | 1.814132% |
| C | 46689 | 993 | 2.126839% |
| D | 46689 | 15669 | 33.560368% |
Noise dominated data is calculated using 1-second bins in cleaned event files. If a bin has >2000 counts, and if more than 50% of those come from <1% of pixels, then it is considered to be noise-dominated and hence unusable.
| Quadrant | # 1 sec bins | Bins with >0 counts | Bins with >2000 counts | High rate bins dominated by noise | Noise dominated (total time) | Noise dominated (detector-on time) | Marked lightcurve |
|---|---|---|---|---|---|---|---|
| A | 52289 | 46691 | 37 | 37 | 0.07% | 0.08% | 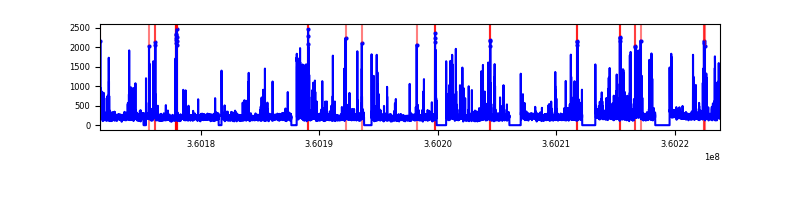 |
| B | 52289 | 46691 | 1 | 1 | 0.00% | 0.00% | 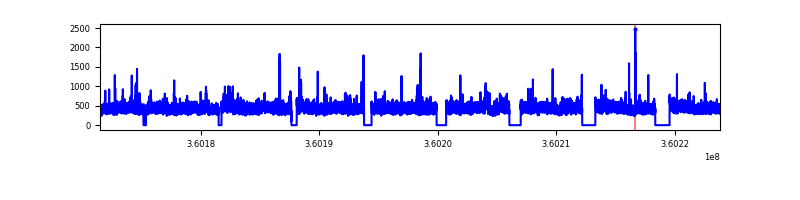 |
| C | 52289 | 46691 | 4 | 4 | 0.01% | 0.01% |  |
| D | 52289 | 46690 | 6228 | 6228 | 11.91% | 13.34% |  |
Top three noisy pixels from each quadrant. If the there are fewer than three noisy pixels in the level2.evt file, extra rows are filled as -1
| Pixel properties | Quadrant properties | ||||||
|---|---|---|---|---|---|---|---|
| Quadrant | DetID | PixID | Counts | Sigma | Mean | Median | Sigma |
| A | 0 | 13 | 1699335 | 3144.33 | 2527 | 2494 | 539.7 |
| A | 13 | 254 | 81894 | 147.13 | 2527 | 2494 | 539.7 |
| A | 8 | 192 | 80778 | 145.06 | 2527 | 2494 | 539.7 |
| B | 6 | 159 | 12844034 | 27013.35 | 2517 | 2465 | 475.4 |
| B | 0 | 190 | 222322 | 462.49 | 2517 | 2465 | 475.4 |
| B | 0 | 230 | 90100 | 184.35 | 2517 | 2465 | 475.4 |
| C | 3 | 233 | 1219767 | 2123.47 | 2427 | 2422 | 573.3 |
| C | 10 | 22 | 661085 | 1148.94 | 2427 | 2422 | 573.3 |
| C | 2 | 16 | 127391 | 217.99 | 2427 | 2422 | 573.3 |
| D | 8 | 195 | 37254028 | 71654.41 | 2229 | 2164 | 519.9 |
| D | 12 | 227 | 5212080 | 10021.34 | 2229 | 2164 | 519.9 |
| D | 12 | 218 | 3721321 | 7153.84 | 2229 | 2164 | 519.9 |
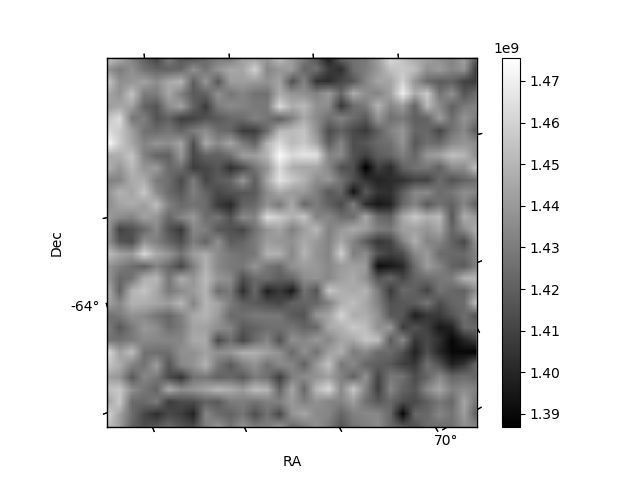
Histogram calculated using DETX and DETY for each event in the final _common_clean file
| Quadrant A |  |
 |
Quadrant B |
|---|---|---|---|
| Quadrant D |  |
 |
Quadrant C |
| Plot type | Count rate plots | Images |
|---|---|---|
| Comparison with Poisson distribution Blue bars denote a histogram of data divided into 1 sec bins. Red curve is a Poisson curve with rate = median count rate of data. |
 |
 |
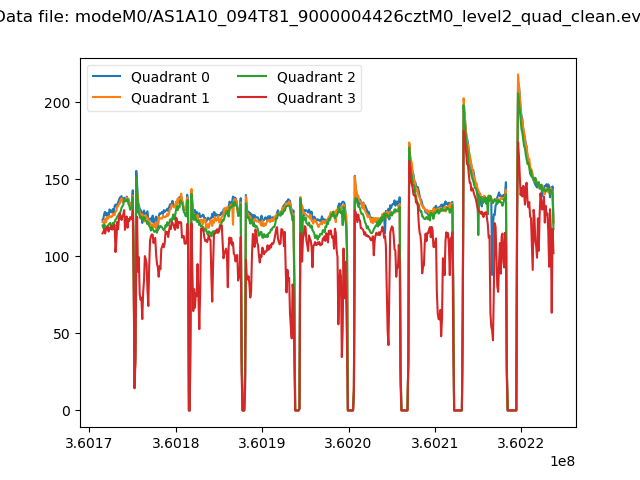
| Quadrant-wise count rates Data is divided into 100 sec bins |
 |
|
| Module-wise count rates for Quadrant A Data is divided into 100 sec bins |
 |
 |
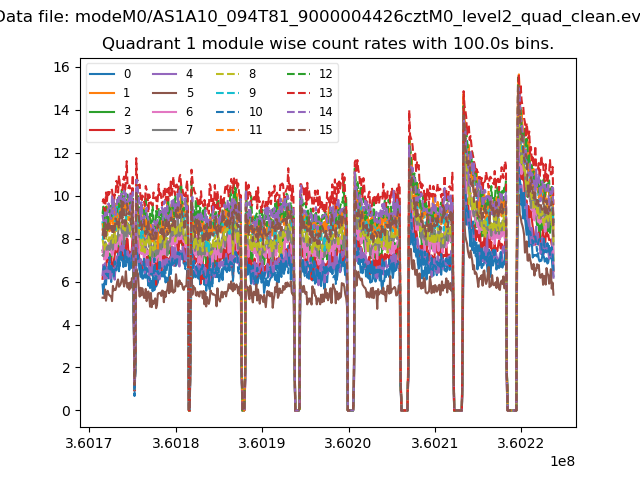
| Module-wise count rates for Quadrant B Data is divided into 100 sec bins |
 |
 |
| Module-wise count rates for Quadrant C Data is divided into 100 sec bins |
 |
 |
| Module-wise count rates for Quadrant D Data is divided into 100 sec bins |
 |
 |
| Parameter | Plot |
|---|---|
| CZT HV Monitor |  |
| D_VDD |  |
| Temperature 1 |  |
| Veto HV Monitor |  |
| Veto LLD |  |
| Alpha Counter |  |
| _CPM_Rate | 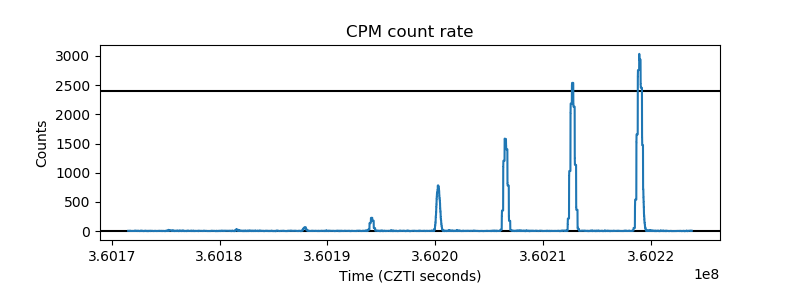 |
| CZT Counter | 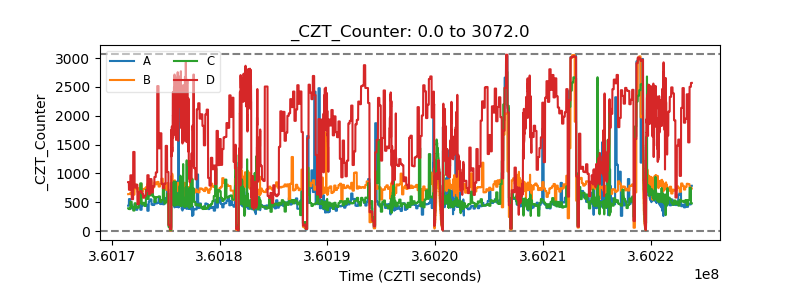 |
| +2.5 Volts monitor |  |
| +5 Volts monitor |  |
| _ROLL_ROT |  |
| _Roll_DEC |  |
| _Roll_RA |  |
| Veto Counter |  |