| Param | Original file | Final file |
|---|---|---|
| Filename | modeM0/AS1A10_094T80_9000004424cztM0_level2_bc.evt | modeM0/AS1A10_094T80_9000004424cztM0_level2_quad_clean.evt |
| Size (bytes) | 1,636,084,800 | 491,031,360 |
| Size | 1.5 GB | 468.3 MB |
| Events in quadrant A | 6,205,179 | 3,480,919 |
| Events in quadrant B | 12,077,760 | 3,418,437 |
| Events in quadrant C | 6,402,015 | 3,322,094 |
| Events in quadrant D | 23,259,206 | 3,025,956 |
| Mode M9 | |||
|---|---|---|---|
| Quadrant | BADHDUFLAG | Total packets | Discarded packets |
| A | 0 | 54 | 0 |
| B | 0 | 54 | 0 |
| C | 0 | 54 | 0 |
| D | 0 | 54 | 0 |
| Mode SS | |||
|---|---|---|---|
| Quadrant | BADHDUFLAG | Total packets | Discarded packets |
| A | 0 | 480 | 0 |
| B | 0 | 480 | 0 |
| C | 0 | 480 | 0 |
| D | 0 | 480 | 0 |
| Mode M0 | |||
|---|---|---|---|
| Quadrant | BADHDUFLAG | Total packets | Discarded packets |
| A | 0 | 52790 | 0 |
| B | 0 | 73049 | 0 |
| C | 0 | 54303 | 0 |
| D | 0 | 109685 | 0 |
| Quadrant | Total seconds | Saturated seconds | Saturation percentage |
|---|---|---|---|
| A | 23627 | 530 | 2.243196% |
| B | 23627 | 743 | 3.144707% |
| C | 23627 | 717 | 3.034664% |
| D | 23627 | 4092 | 17.319169% |
Noise dominated data is calculated using 1-second bins in cleaned event files. If a bin has >2000 counts, and if more than 50% of those come from <1% of pixels, then it is considered to be noise-dominated and hence unusable.
| Quadrant | # 1 sec bins | Bins with >0 counts | Bins with >2000 counts | High rate bins dominated by noise | Noise dominated (total time) | Noise dominated (detector-on time) | Marked lightcurve |
|---|---|---|---|---|---|---|---|
| A | 28947 | 23629 | 13 | 13 | 0.04% | 0.06% |  |
| B | 28947 | 23628 | 0 | 0 | 0.00% | 0.00% | 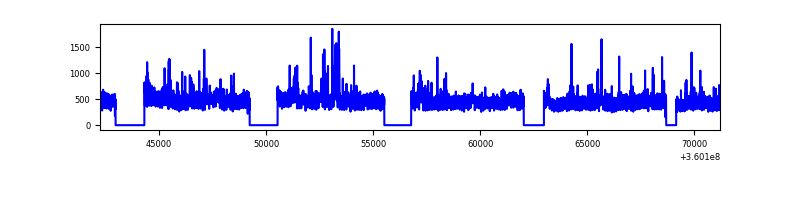 |
| C | 28947 | 23627 | 0 | 0 | 0.00% | 0.00% |  |
| D | 28947 | 23626 | 1583 | 1583 | 5.47% | 6.70% |  |
Top three noisy pixels from each quadrant. If the there are fewer than three noisy pixels in the level2.evt file, extra rows are filled as -1
| Pixel properties | Quadrant properties | ||||||
|---|---|---|---|---|---|---|---|
| Quadrant | DetID | PixID | Counts | Sigma | Mean | Median | Sigma |
| A | 0 | 13 | 661267 | 2201.71 | 1400 | 1385 | 299.7 |
| A | 15 | 174 | 88069 | 289.22 | 1400 | 1385 | 299.7 |
| A | 8 | 192 | 44870 | 145.09 | 1400 | 1385 | 299.7 |
| B | 6 | 159 | 6294453 | 24276.67 | 1375 | 1349 | 259.2 |
| B | 4 | 81 | 318438 | 1223.22 | 1375 | 1349 | 259.2 |
| B | 0 | 190 | 85802 | 325.79 | 1375 | 1349 | 259.2 |
| C | 3 | 233 | 1030785 | 3275.39 | 1327 | 1331 | 314.3 |
| C | 0 | 10 | 134208 | 422.77 | 1327 | 1331 | 314.3 |
| C | 10 | 22 | 62022 | 193.1 | 1327 | 1331 | 314.3 |
| D | 8 | 195 | 11499852 | 39243.97 | 1293 | 1265 | 293.0 |
| D | 12 | 227 | 1923786 | 6561.45 | 1293 | 1265 | 293.0 |
| D | 1 | 52 | 1648859 | 5623.14 | 1293 | 1265 | 293.0 |
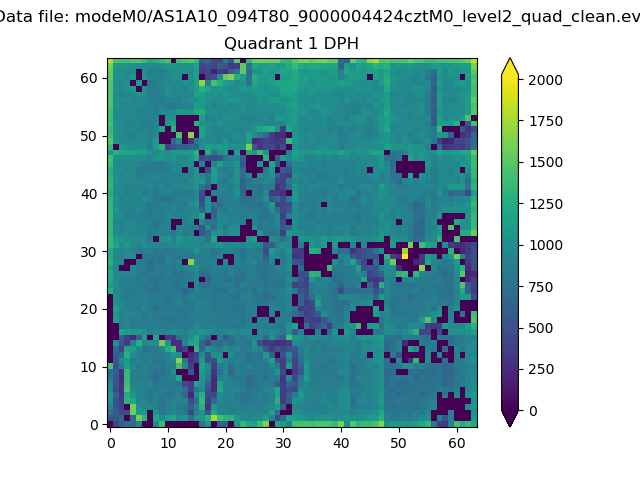
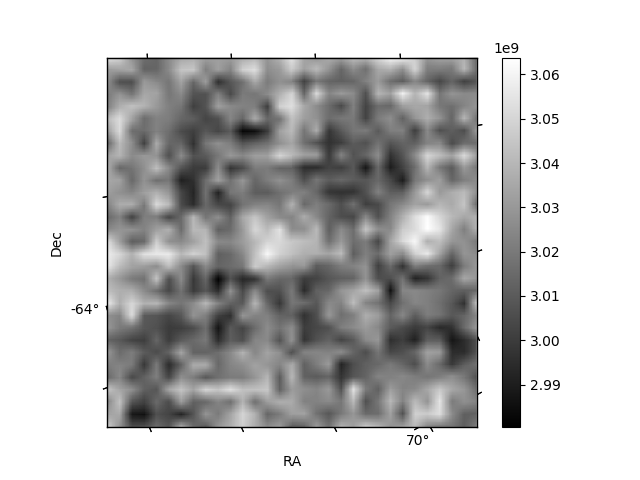
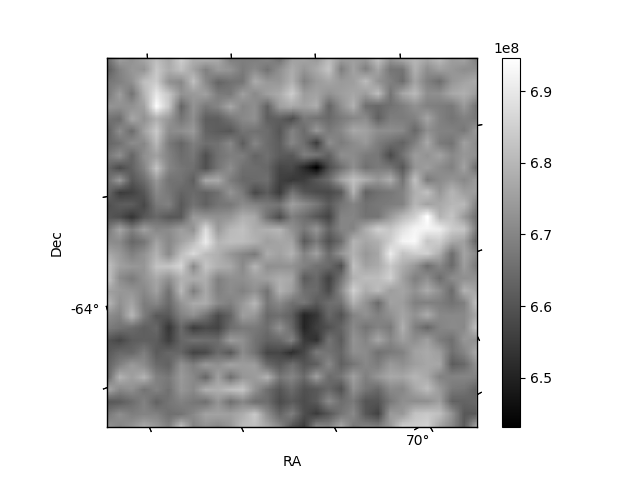
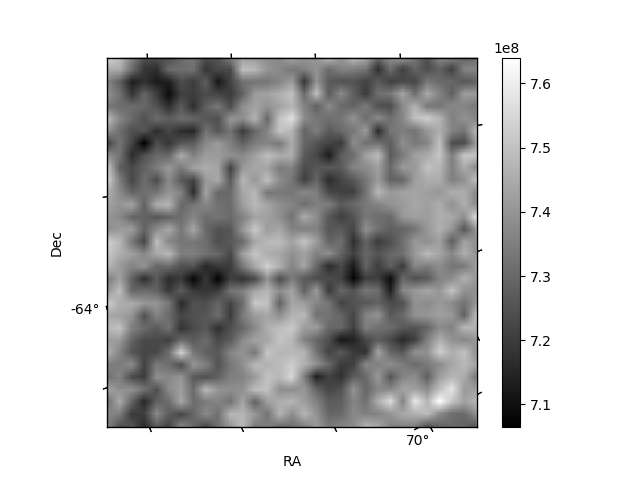
Histogram calculated using DETX and DETY for each event in the final _common_clean file
| Quadrant A |  |
 |
Quadrant B |
|---|---|---|---|
| Quadrant D | 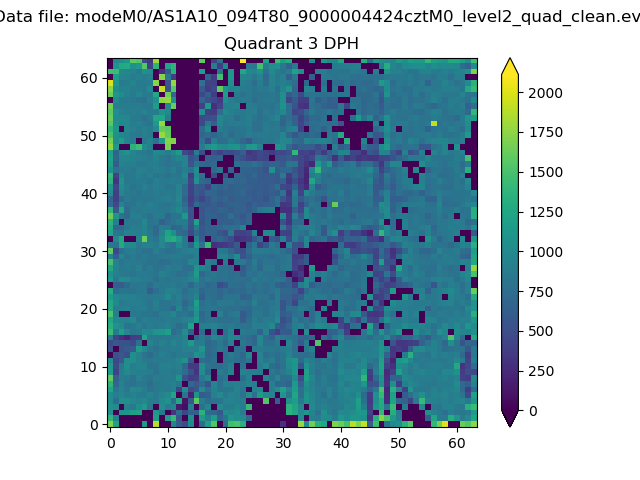 |
 |
Quadrant C |
| Plot type | Count rate plots | Images |
|---|---|---|
| Comparison with Poisson distribution Blue bars denote a histogram of data divided into 1 sec bins. Red curve is a Poisson curve with rate = median count rate of data. |
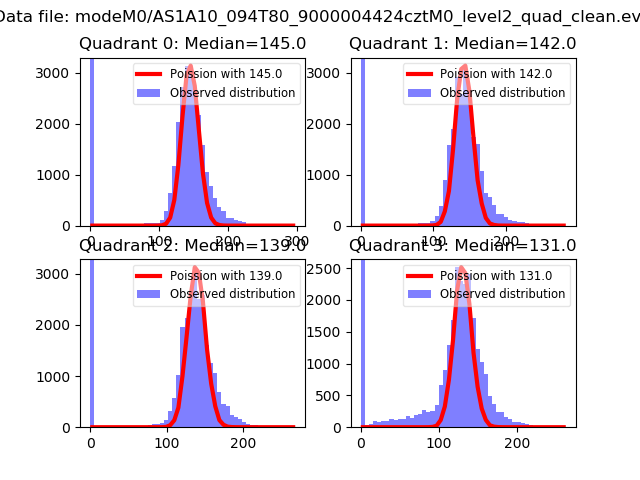 |
 |
| Quadrant-wise count rates Data is divided into 100 sec bins |
 |
|
| Module-wise count rates for Quadrant A Data is divided into 100 sec bins |
 |
 |
| Module-wise count rates for Quadrant B Data is divided into 100 sec bins |
 |
 |
| Module-wise count rates for Quadrant C Data is divided into 100 sec bins |
 |
 |
| Module-wise count rates for Quadrant D Data is divided into 100 sec bins |
 |
 |
| Parameter | Plot |
|---|---|
| CZT HV Monitor | 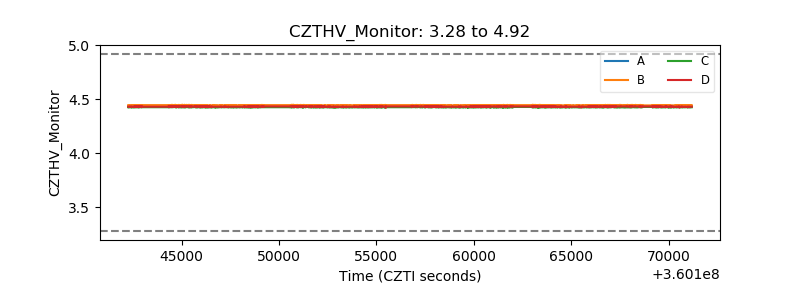 |
| D_VDD |  |
| Temperature 1 |  |
| Veto HV Monitor |  |
| Veto LLD |  |
| Alpha Counter | 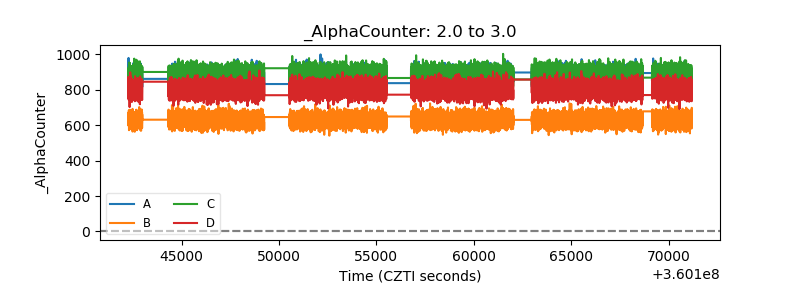 |
| _CPM_Rate |  |
| CZT Counter |  |
| +2.5 Volts monitor |  |
| +5 Volts monitor |  |
| _ROLL_ROT |  |
| _Roll_DEC | 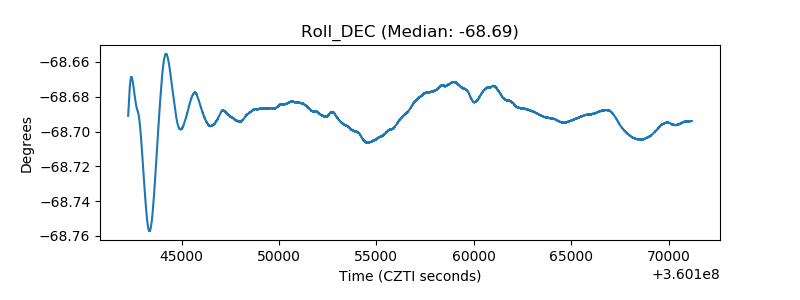 |
| _Roll_RA |  |
| Veto Counter |  |