| Param | Original file | Final file |
|---|---|---|
| Filename | modeM0/AS1C05_007T01_9000004418cztM0_level2_bc.evt | modeM0/AS1C05_007T01_9000004418cztM0_level2_quad_clean.evt |
| Size (bytes) | 3,295,598,400 | 619,499,520 |
| Size | 3.1 GB | 590.8 MB |
| Events in quadrant A | 12,238,949 | 4,073,210 |
| Events in quadrant B | 26,734,583 | 3,993,061 |
| Events in quadrant C | 12,922,972 | 3,834,558 |
| Events in quadrant D | 44,631,657 | 3,539,821 |
| Mode M0 | |||
|---|---|---|---|
| Quadrant | BADHDUFLAG | Total packets | Discarded packets |
| A | 0 | 106750 | 0 |
| B | 0 | 161999 | 0 |
| C | 0 | 112307 | 0 |
| D | 0 | 206569 | 0 |
| Mode SS | |||
|---|---|---|---|
| Quadrant | BADHDUFLAG | Total packets | Discarded packets |
| A | 0 | 984 | 0 |
| B | 0 | 984 | 0 |
| C | 0 | 984 | 0 |
| D | 0 | 984 | 0 |
| Mode M9 | |||
|---|---|---|---|
| Quadrant | BADHDUFLAG | Total packets | Discarded packets |
| A | 0 | 93 | 0 |
| B | 0 | 93 | 0 |
| C | 0 | 93 | 0 |
| D | 0 | 93 | 0 |
| Quadrant | Total seconds | Saturated seconds | Saturation percentage |
|---|---|---|---|
| A | 48400 | 595 | 1.229339% |
| B | 48400 | 3481 | 7.192149% |
| C | 48400 | 957 | 1.977273% |
| D | 48400 | 6017 | 12.431818% |
Noise dominated data is calculated using 1-second bins in cleaned event files. If a bin has >2000 counts, and if more than 50% of those come from <1% of pixels, then it is considered to be noise-dominated and hence unusable.
| Quadrant | # 1 sec bins | Bins with >0 counts | Bins with >2000 counts | High rate bins dominated by noise | Noise dominated (total time) | Noise dominated (detector-on time) | Marked lightcurve |
|---|---|---|---|---|---|---|---|
| A | 57675 | 48400 | 34 | 34 | 0.06% | 0.07% |  |
| B | 57675 | 48401 | 11 | 11 | 0.02% | 0.02% |  |
| C | 57675 | 48400 | 3 | 3 | 0.01% | 0.01% |  |
| D | 57675 | 48402 | 2915 | 2915 | 5.05% | 6.02% | 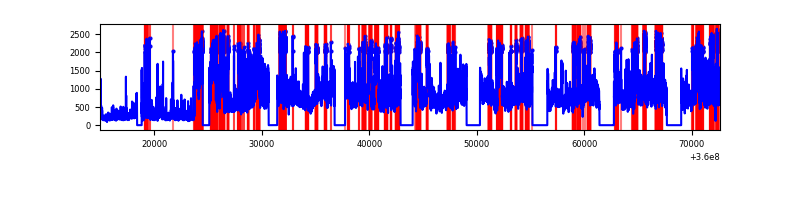 |
Top three noisy pixels from each quadrant. If the there are fewer than three noisy pixels in the level2.evt file, extra rows are filled as -1
| Pixel properties | Quadrant properties | ||||||
|---|---|---|---|---|---|---|---|
| Quadrant | DetID | PixID | Counts | Sigma | Mean | Median | Sigma |
| A | 0 | 13 | 942983 | 1558.17 | 2847 | 2814 | 603.4 |
| A | 12 | 96 | 256867 | 421.05 | 2847 | 2814 | 603.4 |
| A | 13 | 254 | 86249 | 138.28 | 2847 | 2814 | 603.4 |
| B | 6 | 159 | 12635696 | 24351.31 | 2782 | 2724 | 518.8 |
| B | 6 | 36 | 3179962 | 6124.44 | 2782 | 2724 | 518.8 |
| B | 0 | 190 | 108049 | 203.02 | 2782 | 2724 | 518.8 |
| C | 3 | 233 | 2077491 | 3358.56 | 2670 | 2669 | 617.8 |
| C | 0 | 10 | 324211 | 520.49 | 2670 | 2669 | 617.8 |
| C | 2 | 114 | 93003 | 146.23 | 2670 | 2669 | 617.8 |
| D | 8 | 195 | 29570294 | 45320.16 | 2633 | 2577 | 652.4 |
| D | 12 | 227 | 2115806 | 3239.07 | 2633 | 2577 | 652.4 |
| D | 10 | 253 | 1844338 | 2822.97 | 2633 | 2577 | 652.4 |
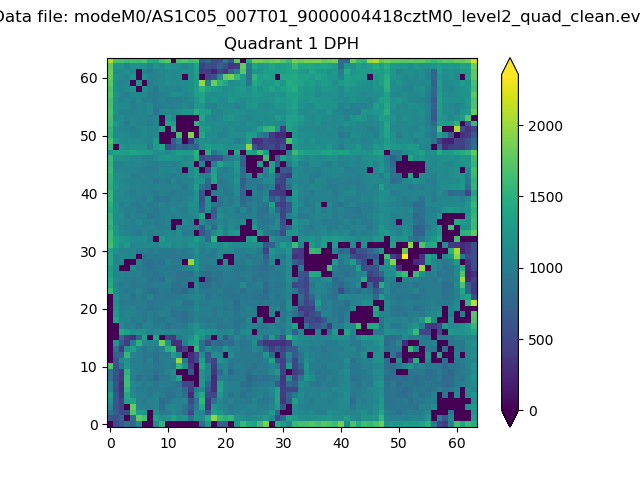
Histogram calculated using DETX and DETY for each event in the final _common_clean file
| Quadrant A |  |
 |
Quadrant B |
|---|---|---|---|
| Quadrant D |  |
 |
Quadrant C |
| Plot type | Count rate plots | Images |
|---|---|---|
| Comparison with Poisson distribution Blue bars denote a histogram of data divided into 1 sec bins. Red curve is a Poisson curve with rate = median count rate of data. |
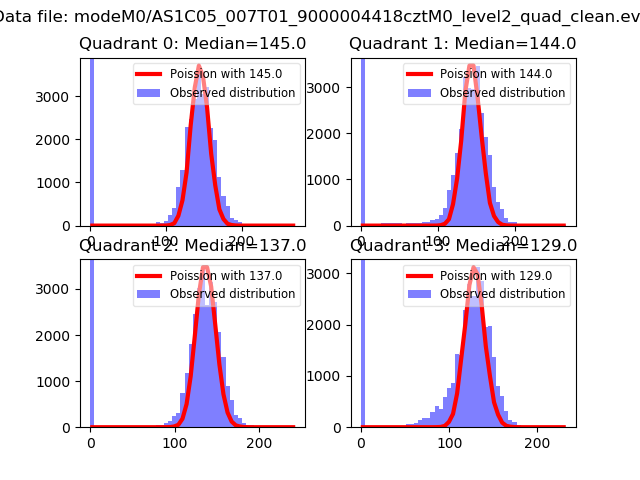 |
 |
| Quadrant-wise count rates Data is divided into 100 sec bins |
 |
|
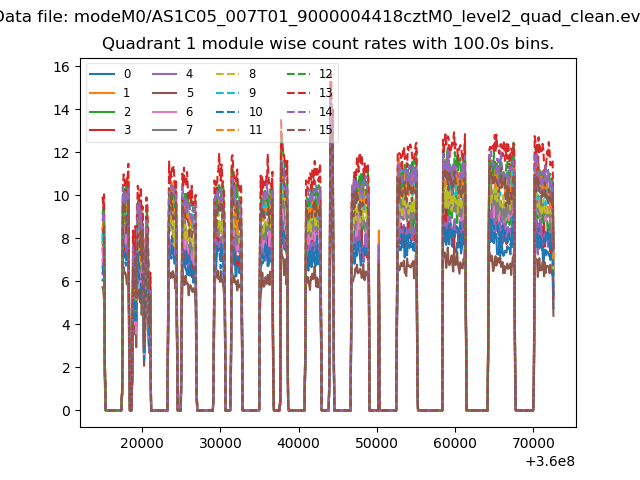
| Module-wise count rates for Quadrant A Data is divided into 100 sec bins |
 |
 |
| Module-wise count rates for Quadrant B Data is divided into 100 sec bins |
 |
 |
| Module-wise count rates for Quadrant C Data is divided into 100 sec bins |
 |
 |
| Module-wise count rates for Quadrant D Data is divided into 100 sec bins |
 |
 |
| Parameter | Plot |
|---|---|
| CZT HV Monitor |  |
| D_VDD |  |
| Temperature 1 |  |
| Veto HV Monitor |  |
| Veto LLD |  |
| Alpha Counter |  |
| _CPM_Rate |  |
| CZT Counter |  |
| +2.5 Volts monitor |  |
| +5 Volts monitor |  |
| _ROLL_ROT |  |
| _Roll_DEC |  |
| _Roll_RA | 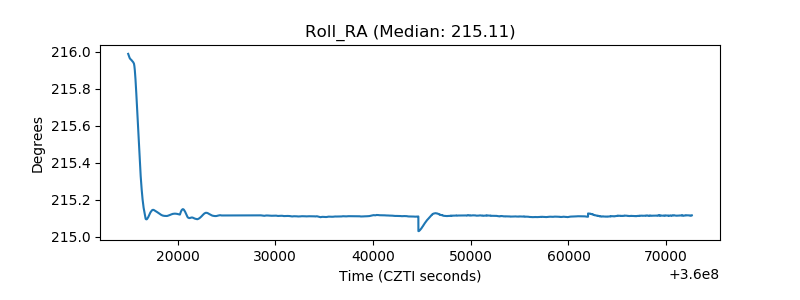 |
| Veto Counter |  |