| Param | Original file | Final file |
|---|---|---|
| Filename | modeM0/AS1A10_103T02_9000004416cztM0_level2_bc.evt | modeM0/AS1A10_103T02_9000004416cztM0_level2_quad_clean.evt |
| Size (bytes) | 4,936,515,840 | 859,893,120 |
| Size | 4.6 GB | 820.1 MB |
| Events in quadrant A | 17,038,419 | 5,699,344 |
| Events in quadrant B | 31,855,194 | 5,666,807 |
| Events in quadrant C | 17,904,660 | 5,439,178 |
| Events in quadrant D | 78,436,931 | 4,907,895 |
| Mode M9 | |||
|---|---|---|---|
| Quadrant | BADHDUFLAG | Total packets | Discarded packets |
| A | 0 | 105 | 0 |
| B | 0 | 105 | 0 |
| C | 0 | 105 | 0 |
| D | 0 | 105 | 0 |
| Mode M0 | |||
|---|---|---|---|
| Quadrant | BADHDUFLAG | Total packets | Discarded packets |
| A | 0 | 142982 | 0 |
| B | 0 | 194691 | 0 |
| C | 0 | 149802 | 0 |
| D | 0 | 330686 | 0 |
| Mode SS | |||
|---|---|---|---|
| Quadrant | BADHDUFLAG | Total packets | Discarded packets |
| A | 0 | 1290 | 0 |
| B | 0 | 1290 | 0 |
| C | 0 | 1290 | 0 |
| D | 0 | 1290 | 0 |
| Quadrant | Total seconds | Saturated seconds | Saturation percentage |
|---|---|---|---|
| A | 63094 | 1473 | 2.334612% |
| B | 63094 | 1778 | 2.818018% |
| C | 63094 | 2704 | 4.285669% |
| D | 63094 | 14008 | 22.201794% |
Noise dominated data is calculated using 1-second bins in cleaned event files. If a bin has >2000 counts, and if more than 50% of those come from <1% of pixels, then it is considered to be noise-dominated and hence unusable.
| Quadrant | # 1 sec bins | Bins with >0 counts | Bins with >2000 counts | High rate bins dominated by noise | Noise dominated (total time) | Noise dominated (detector-on time) | Marked lightcurve |
|---|---|---|---|---|---|---|---|
| A | 73919 | 63100 | 74 | 74 | 0.10% | 0.12% |  |
| B | 73919 | 63097 | 29 | 29 | 0.04% | 0.05% | 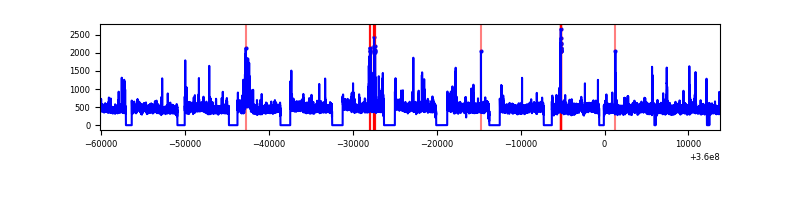 |
| C | 73919 | 63095 | 161 | 161 | 0.22% | 0.26% |  |
| D | 73919 | 63095 | 7729 | 7729 | 10.46% | 12.25% |  |
Top three noisy pixels from each quadrant. If the there are fewer than three noisy pixels in the level2.evt file, extra rows are filled as -1
| Pixel properties | Quadrant properties | ||||||
|---|---|---|---|---|---|---|---|
| Quadrant | DetID | PixID | Counts | Sigma | Mean | Median | Sigma |
| A | 0 | 13 | 2825957 | 3646.8 | 3639 | 3590 | 773.9 |
| A | 8 | 192 | 115705 | 144.86 | 3639 | 3590 | 773.9 |
| A | 13 | 254 | 111864 | 139.9 | 3639 | 3590 | 773.9 |
| B | 6 | 159 | 16677690 | 24611.09 | 3641 | 3574 | 677.5 |
| B | 6 | 36 | 611140 | 896.77 | 3641 | 3574 | 677.5 |
| B | 0 | 229 | 245690 | 357.36 | 3641 | 3574 | 677.5 |
| C | 10 | 22 | 2939587 | 3605.35 | 3478 | 3487 | 814.4 |
| C | 3 | 233 | 965594 | 1181.41 | 3478 | 3487 | 814.4 |
| C | 0 | 10 | 330967 | 402.13 | 3478 | 3487 | 814.4 |
| D | 8 | 195 | 53358697 | 70737.75 | 3329 | 3244 | 754.3 |
| D | 10 | 253 | 7170282 | 9501.94 | 3329 | 3244 | 754.3 |
| D | 12 | 227 | 2547919 | 3373.69 | 3329 | 3244 | 754.3 |
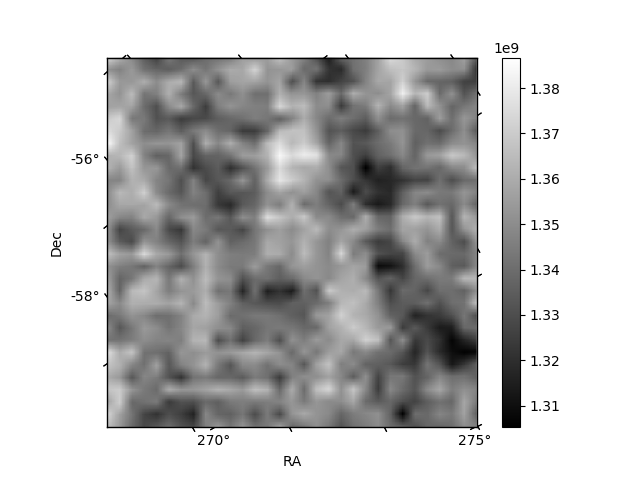
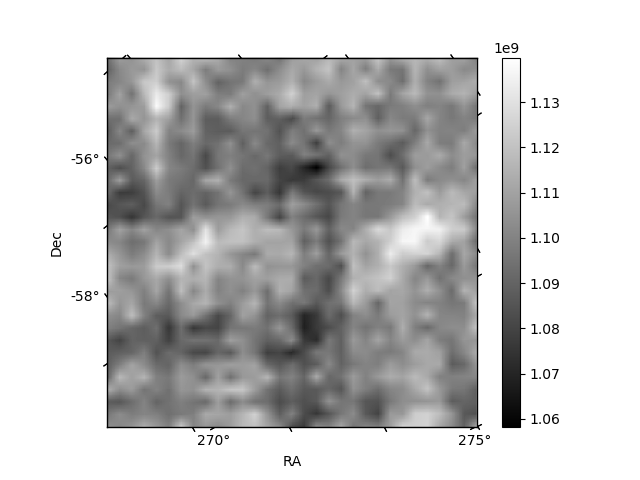
Histogram calculated using DETX and DETY for each event in the final _common_clean file
| Quadrant A |  |
 |
Quadrant B |
|---|---|---|---|
| Quadrant D | 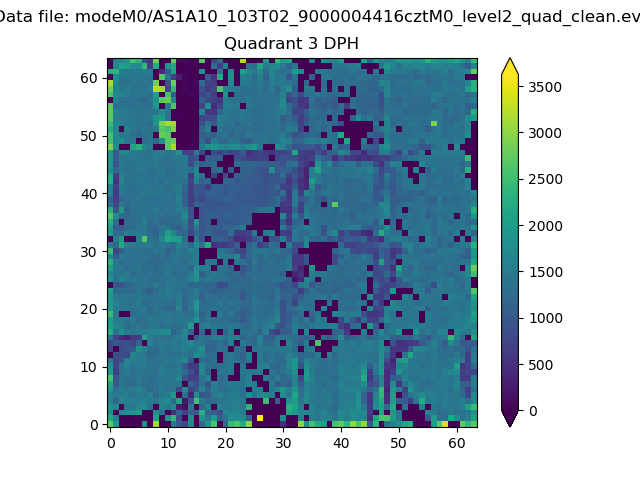 |
 |
Quadrant C |
| Plot type | Count rate plots | Images |
|---|---|---|
| Comparison with Poisson distribution Blue bars denote a histogram of data divided into 1 sec bins. Red curve is a Poisson curve with rate = median count rate of data. |
 |
 |
| Quadrant-wise count rates Data is divided into 100 sec bins |
 |
|
| Module-wise count rates for Quadrant A Data is divided into 100 sec bins |
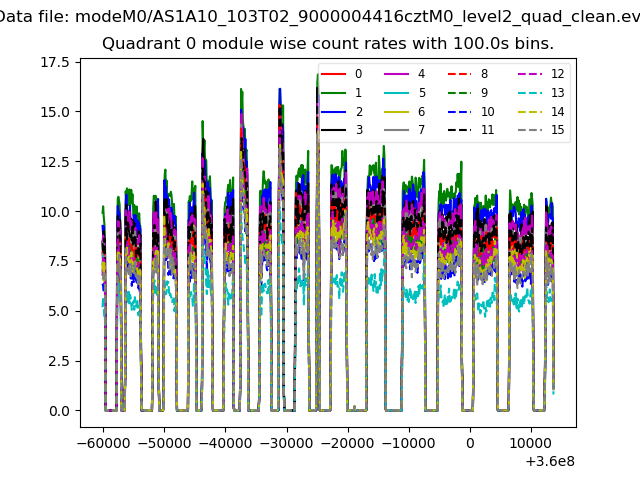 |
 |
| Module-wise count rates for Quadrant B Data is divided into 100 sec bins |
 |
 |
| Module-wise count rates for Quadrant C Data is divided into 100 sec bins |
 |
 |
| Module-wise count rates for Quadrant D Data is divided into 100 sec bins |
 |
 |
| Parameter | Plot |
|---|---|
| CZT HV Monitor |  |
| D_VDD | 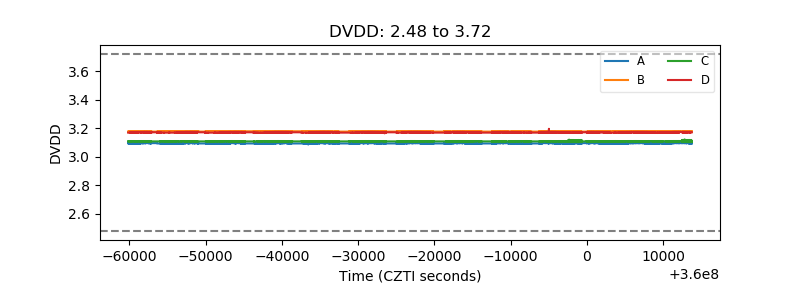 |
| Temperature 1 | 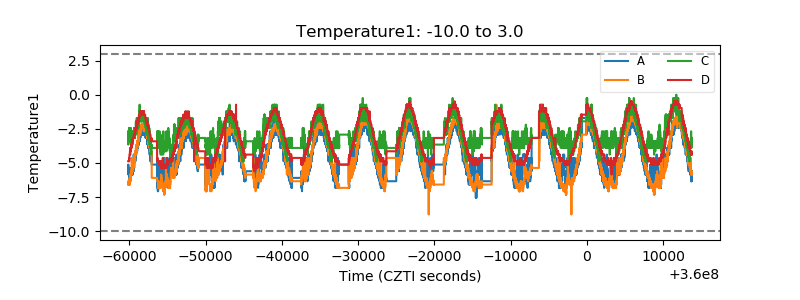 |
| Veto HV Monitor |  |
| Veto LLD |  |
| Alpha Counter |  |
| _CPM_Rate |  |
| CZT Counter |  |
| +2.5 Volts monitor | 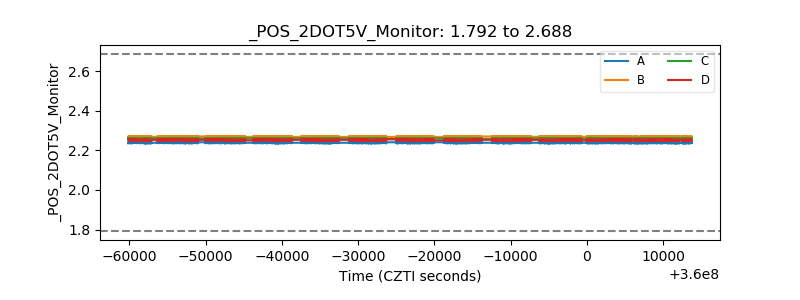 |
| +5 Volts monitor |  |
| _ROLL_ROT |  |
| _Roll_DEC |  |
| _Roll_RA |  |
| Veto Counter |  |