| Param | Original file | Final file |
|---|---|---|
| Filename | modeM0/AS1A10_055T01_9000004414cztM0_level2_bc.evt | modeM0/AS1A10_055T01_9000004414cztM0_level2_quad_clean.evt |
| Size (bytes) | 3,075,396,480 | 674,815,680 |
| Size | 2.9 GB | 643.6 MB |
| Events in quadrant A | 11,592,104 | 4,565,194 |
| Events in quadrant B | 23,308,729 | 4,513,318 |
| Events in quadrant C | 11,012,034 | 4,296,308 |
| Events in quadrant D | 44,105,486 | 3,904,022 |
| Mode M9 | |||
|---|---|---|---|
| Quadrant | BADHDUFLAG | Total packets | Discarded packets |
| A | 0 | 71 | 0 |
| B | 0 | 71 | 0 |
| C | 0 | 71 | 0 |
| D | 0 | 71 | 0 |
| Mode M0 | |||
|---|---|---|---|
| Quadrant | BADHDUFLAG | Total packets | Discarded packets |
| A | 0 | 102155 | 0 |
| B | 0 | 141582 | 0 |
| C | 0 | 102939 | 0 |
| D | 0 | 204161 | 0 |
| Mode SS | |||
|---|---|---|---|
| Quadrant | BADHDUFLAG | Total packets | Discarded packets |
| A | 0 | 938 | 0 |
| B | 0 | 938 | 0 |
| C | 0 | 938 | 0 |
| D | 0 | 938 | 0 |
| Quadrant | Total seconds | Saturated seconds | Saturation percentage |
|---|---|---|---|
| A | 46030 | 894 | 1.942212% |
| B | 46030 | 1285 | 2.791658% |
| C | 46030 | 1488 | 3.232674% |
| D | 46030 | 6857 | 14.896806% |
Noise dominated data is calculated using 1-second bins in cleaned event files. If a bin has >2000 counts, and if more than 50% of those come from <1% of pixels, then it is considered to be noise-dominated and hence unusable.
| Quadrant | # 1 sec bins | Bins with >0 counts | Bins with >2000 counts | High rate bins dominated by noise | Noise dominated (total time) | Noise dominated (detector-on time) | Marked lightcurve |
|---|---|---|---|---|---|---|---|
| A | 53115 | 46031 | 26 | 26 | 0.05% | 0.06% |  |
| B | 53115 | 46031 | 7 | 7 | 0.01% | 0.02% |  |
| C | 53115 | 46030 | 10 | 10 | 0.02% | 0.02% |  |
| D | 53115 | 46031 | 3196 | 3196 | 6.02% | 6.94% |  |
Top three noisy pixels from each quadrant. If the there are fewer than three noisy pixels in the level2.evt file, extra rows are filled as -1
| Pixel properties | Quadrant properties | ||||||
|---|---|---|---|---|---|---|---|
| Quadrant | DetID | PixID | Counts | Sigma | Mean | Median | Sigma |
| A | 0 | 13 | 1138552 | 1984.08 | 2683 | 2647 | 572.5 |
| A | 13 | 254 | 85854 | 145.34 | 2683 | 2647 | 572.5 |
| A | 8 | 192 | 82161 | 138.89 | 2683 | 2647 | 572.5 |
| B | 6 | 159 | 12457571 | 24656.56 | 2664 | 2610 | 505.1 |
| B | 6 | 36 | 153192 | 298.1 | 2664 | 2610 | 505.1 |
| B | 0 | 229 | 125851 | 243.98 | 2664 | 2610 | 505.1 |
| C | 3 | 233 | 471931 | 804.52 | 2509 | 2509 | 583.5 |
| C | 10 | 22 | 431228 | 734.76 | 2509 | 2509 | 583.5 |
| C | 0 | 10 | 222838 | 377.61 | 2509 | 2509 | 583.5 |
| D | 8 | 195 | 29604271 | 51996.61 | 2495 | 2424 | 569.3 |
| D | 10 | 253 | 1556874 | 2730.44 | 2495 | 2424 | 569.3 |
| D | 13 | 249 | 807308 | 1413.81 | 2495 | 2424 | 569.3 |
Histogram calculated using DETX and DETY for each event in the final _common_clean file
| Quadrant A |  |
 |
Quadrant B |
|---|---|---|---|
| Quadrant D |  |
 |
Quadrant C |
| Plot type | Count rate plots | Images |
|---|---|---|
| Comparison with Poisson distribution Blue bars denote a histogram of data divided into 1 sec bins. Red curve is a Poisson curve with rate = median count rate of data. |
 |
 |
| Quadrant-wise count rates Data is divided into 100 sec bins |
 |
|
| Module-wise count rates for Quadrant A Data is divided into 100 sec bins |
 |
 |
| Module-wise count rates for Quadrant B Data is divided into 100 sec bins |
 |
 |
| Module-wise count rates for Quadrant C Data is divided into 100 sec bins |
 |
 |
| Module-wise count rates for Quadrant D Data is divided into 100 sec bins |
 |
 |
| Parameter | Plot |
|---|---|
| CZT HV Monitor |  |
| D_VDD |  |
| Temperature 1 | 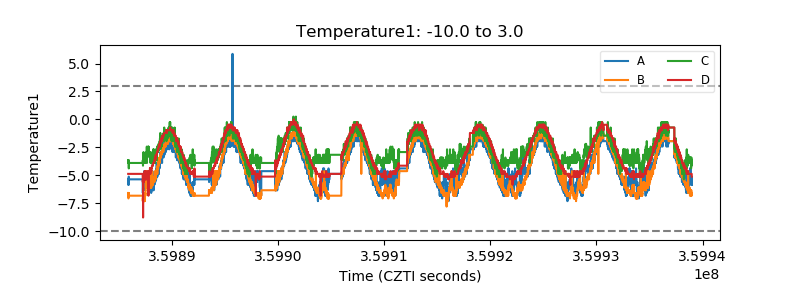 |
| Veto HV Monitor | 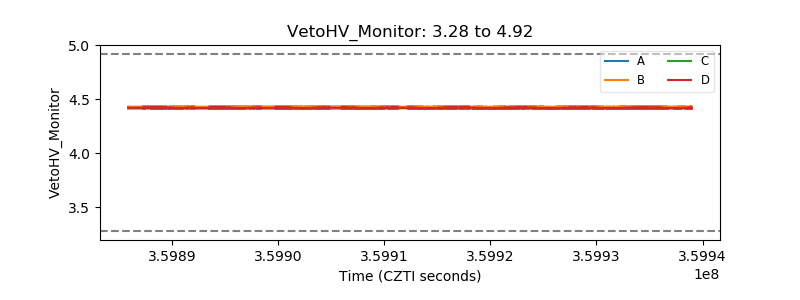 |
| Veto LLD |  |
| Alpha Counter |  |
| _CPM_Rate |  |
| CZT Counter | 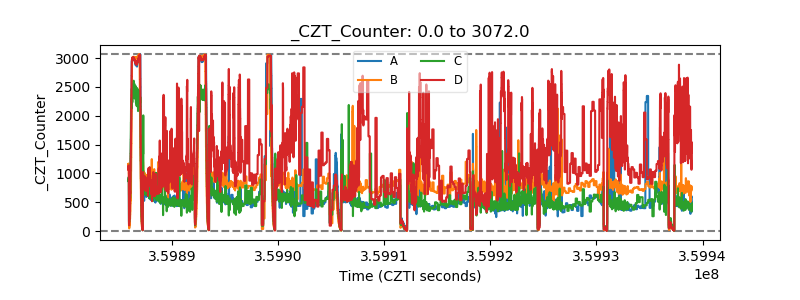 |
| +2.5 Volts monitor |  |
| +5 Volts monitor |  |
| _ROLL_ROT |  |
| _Roll_DEC | 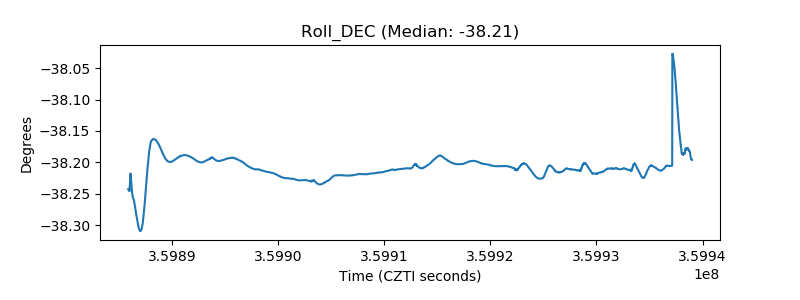 |
| _Roll_RA |  |
| Veto Counter |  |