| Param | Original file | Final file |
|---|---|---|
| Filename | modeM0/AS1A10_071T05_9000004412cztM0_level2_bc.evt | modeM0/AS1A10_071T05_9000004412cztM0_level2_quad_clean.evt |
| Size (bytes) | 3,571,914,240 | 954,936,000 |
| Size | 3.3 GB | 910.7 MB |
| Events in quadrant A | 16,600,425 | 6,252,344 |
| Events in quadrant B | 34,799,623 | 6,197,529 |
| Events in quadrant C | 17,252,090 | 5,888,941 |
| Events in quadrant D | 34,737,934 | 5,752,694 |
| Mode M0 | |||
|---|---|---|---|
| Quadrant | BADHDUFLAG | Total packets | Discarded packets |
| A | 0 | 153278 | 0 |
| B | 0 | 215786 | 0 |
| C | 0 | 157934 | 0 |
| D | 0 | 211793 | 0 |
| Mode M9 | |||
|---|---|---|---|
| Quadrant | BADHDUFLAG | Total packets | Discarded packets |
| A | 0 | 108 | 0 |
| B | 0 | 108 | 0 |
| C | 0 | 108 | 0 |
| D | 0 | 108 | 0 |
| Mode SS | |||
|---|---|---|---|
| Quadrant | BADHDUFLAG | Total packets | Discarded packets |
| A | 0 | 1436 | 0 |
| B | 0 | 1436 | 0 |
| C | 0 | 1436 | 0 |
| D | 0 | 1436 | 0 |
| Quadrant | Total seconds | Saturated seconds | Saturation percentage |
|---|---|---|---|
| A | 70483 | 1129 | 1.601805% |
| B | 70483 | 1576 | 2.236000% |
| C | 70483 | 2388 | 3.388051% |
| D | 70483 | 1690 | 2.397741% |
Noise dominated data is calculated using 1-second bins in cleaned event files. If a bin has >2000 counts, and if more than 50% of those come from <1% of pixels, then it is considered to be noise-dominated and hence unusable.
| Quadrant | # 1 sec bins | Bins with >0 counts | Bins with >2000 counts | High rate bins dominated by noise | Noise dominated (total time) | Noise dominated (detector-on time) | Marked lightcurve |
|---|---|---|---|---|---|---|---|
| A | 81274 | 70489 | 22 | 22 | 0.03% | 0.03% |  |
| B | 81274 | 70487 | 12 | 12 | 0.01% | 0.02% |  |
| C | 81274 | 70487 | 48 | 48 | 0.06% | 0.07% | 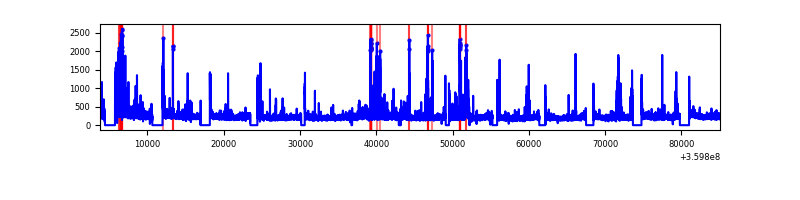 |
| D | 81274 | 70486 | 212 | 212 | 0.26% | 0.30% |  |
Top three noisy pixels from each quadrant. If the there are fewer than three noisy pixels in the level2.evt file, extra rows are filled as -1
| Pixel properties | Quadrant properties | ||||||
|---|---|---|---|---|---|---|---|
| Quadrant | DetID | PixID | Counts | Sigma | Mean | Median | Sigma |
| A | 0 | 13 | 929382 | 1091.94 | 4011 | 3954 | 847.5 |
| A | 13 | 254 | 126351 | 144.42 | 4011 | 3954 | 847.5 |
| A | 8 | 192 | 111695 | 127.13 | 4011 | 3954 | 847.5 |
| B | 6 | 159 | 18751136 | 25038.62 | 3989 | 3903 | 748.7 |
| B | 0 | 229 | 247459 | 325.29 | 3989 | 3903 | 748.7 |
| B | 0 | 190 | 169134 | 220.68 | 3989 | 3903 | 748.7 |
| C | 9 | 54 | 1152748 | 1316.78 | 3754 | 3761 | 872.6 |
| C | 0 | 10 | 481945 | 548.02 | 3754 | 3761 | 872.6 |
| C | 15 | 208 | 376351 | 427.0 | 3754 | 3761 | 872.6 |
| D | 8 | 195 | 14230989 | 16281.84 | 3882 | 3774 | 873.8 |
| D | 1 | 52 | 2646249 | 3024.09 | 3882 | 3774 | 873.8 |
| D | 12 | 227 | 775012 | 882.62 | 3882 | 3774 | 873.8 |
Histogram calculated using DETX and DETY for each event in the final _common_clean file
| Quadrant A | 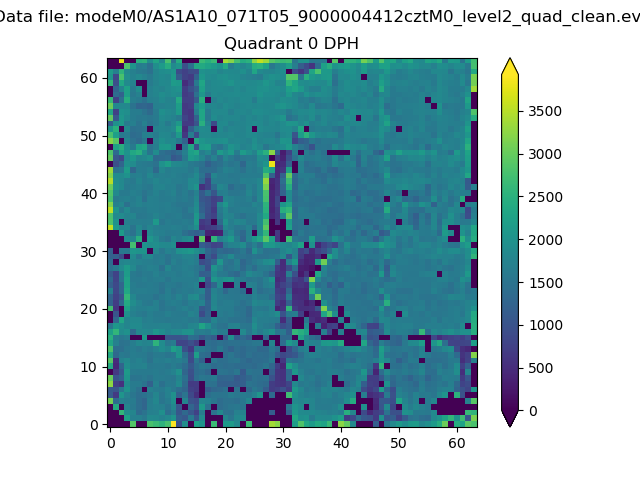 |
 |
Quadrant B |
|---|---|---|---|
| Quadrant D |  |
 |
Quadrant C |
| Plot type | Count rate plots | Images |
|---|---|---|
| Comparison with Poisson distribution Blue bars denote a histogram of data divided into 1 sec bins. Red curve is a Poisson curve with rate = median count rate of data. |
 |
 |
| Quadrant-wise count rates Data is divided into 100 sec bins |
 |
|
| Module-wise count rates for Quadrant A Data is divided into 100 sec bins |
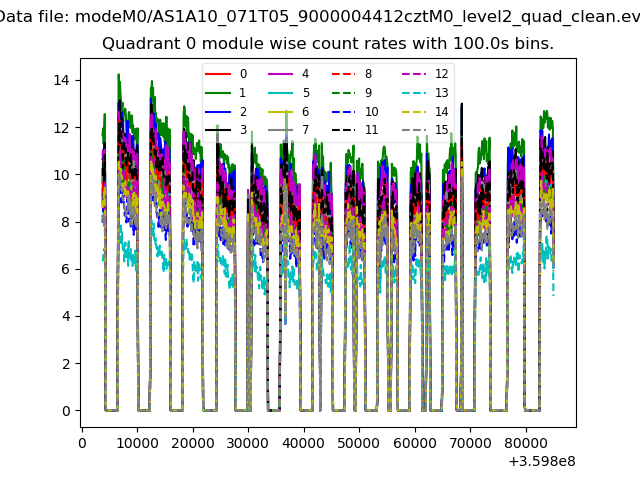 |
 |
| Module-wise count rates for Quadrant B Data is divided into 100 sec bins |
 |
 |
| Module-wise count rates for Quadrant C Data is divided into 100 sec bins |
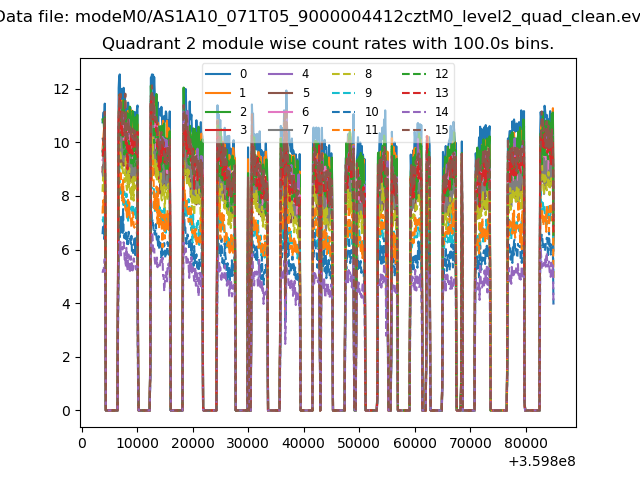 |
 |
| Module-wise count rates for Quadrant D Data is divided into 100 sec bins |
 |
 |
| Parameter | Plot |
|---|---|
| CZT HV Monitor | 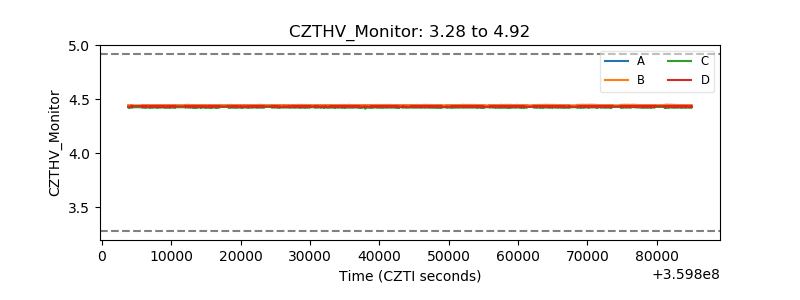 |
| D_VDD |  |
| Temperature 1 |  |
| Veto HV Monitor |  |
| Veto LLD |  |
| Alpha Counter |  |
| _CPM_Rate |  |
| CZT Counter |  |
| +2.5 Volts monitor |  |
| +5 Volts monitor | 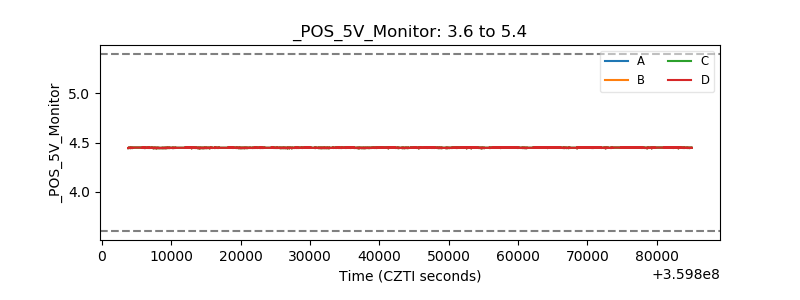 |
| _ROLL_ROT |  |
| _Roll_DEC |  |
| _Roll_RA |  |
| Veto Counter |  |