| Param | Original file | Final file |
|---|---|---|
| Filename | modeM0/AS1A10_021T09_9000004410cztM0_level2_bc.evt | modeM0/AS1A10_021T09_9000004410cztM0_level2_quad_clean.evt |
| Size (bytes) | 2,101,904,640 | 437,843,520 |
| Size | 2.0 GB | 417.6 MB |
| Events in quadrant A | 9,656,025 | 2,869,035 |
| Events in quadrant B | 17,491,934 | 2,829,470 |
| Events in quadrant C | 9,667,893 | 2,692,005 |
| Events in quadrant D | 24,494,723 | 2,496,584 |
| Mode M0 | |||
|---|---|---|---|
| Quadrant | BADHDUFLAG | Total packets | Discarded packets |
| A | 0 | 79536 | 0 |
| B | 0 | 105617 | 0 |
| C | 0 | 81392 | 0 |
| D | 0 | 130536 | 0 |
| Mode M9 | |||
|---|---|---|---|
| Quadrant | BADHDUFLAG | Total packets | Discarded packets |
| A | 0 | 56 | 0 |
| B | 0 | 56 | 0 |
| C | 0 | 56 | 0 |
| D | 0 | 56 | 0 |
| Mode SS | |||
|---|---|---|---|
| Quadrant | BADHDUFLAG | Total packets | Discarded packets |
| A | 0 | 704 | 0 |
| B | 0 | 704 | 0 |
| C | 0 | 704 | 0 |
| D | 0 | 704 | 0 |
| Quadrant | Total seconds | Saturated seconds | Saturation percentage |
|---|---|---|---|
| A | 34541 | 603 | 1.745751% |
| B | 34541 | 468 | 1.354912% |
| C | 34541 | 1521 | 4.403463% |
| D | 34541 | 3019 | 8.740338% |
Noise dominated data is calculated using 1-second bins in cleaned event files. If a bin has >2000 counts, and if more than 50% of those come from <1% of pixels, then it is considered to be noise-dominated and hence unusable.
| Quadrant | # 1 sec bins | Bins with >0 counts | Bins with >2000 counts | High rate bins dominated by noise | Noise dominated (total time) | Noise dominated (detector-on time) | Marked lightcurve |
|---|---|---|---|---|---|---|---|
| A | 40191 | 34542 | 41 | 41 | 0.10% | 0.12% |  |
| B | 40191 | 34541 | 10 | 10 | 0.02% | 0.03% |  |
| C | 40191 | 34540 | 17 | 17 | 0.04% | 0.05% |  |
| D | 40191 | 34539 | 446 | 446 | 1.11% | 1.29% |  |
Top three noisy pixels from each quadrant. If the there are fewer than three noisy pixels in the level2.evt file, extra rows are filled as -1
| Pixel properties | Quadrant properties | ||||||
|---|---|---|---|---|---|---|---|
| Quadrant | DetID | PixID | Counts | Sigma | Mean | Median | Sigma |
| A | 0 | 13 | 1957722 | 4577.83 | 1977 | 1951 | 427.2 |
| A | 8 | 192 | 64346 | 146.05 | 1977 | 1951 | 427.2 |
| A | 13 | 254 | 59899 | 135.64 | 1977 | 1951 | 427.2 |
| B | 6 | 159 | 9415623 | 25272.61 | 1965 | 1922 | 372.5 |
| B | 0 | 229 | 295400 | 787.89 | 1965 | 1922 | 372.5 |
| B | 0 | 190 | 76716 | 200.8 | 1965 | 1922 | 372.5 |
| C | 15 | 208 | 1704121 | 3937.28 | 1841 | 1841 | 432.3 |
| C | 3 | 233 | 349727 | 804.64 | 1841 | 1841 | 432.3 |
| C | 0 | 10 | 319360 | 734.4 | 1841 | 1841 | 432.3 |
| D | 8 | 195 | 12781691 | 30206.45 | 1847 | 1795 | 423.1 |
| D | 12 | 218 | 2044092 | 4827.16 | 1847 | 1795 | 423.1 |
| D | 1 | 52 | 1324271 | 3125.79 | 1847 | 1795 | 423.1 |
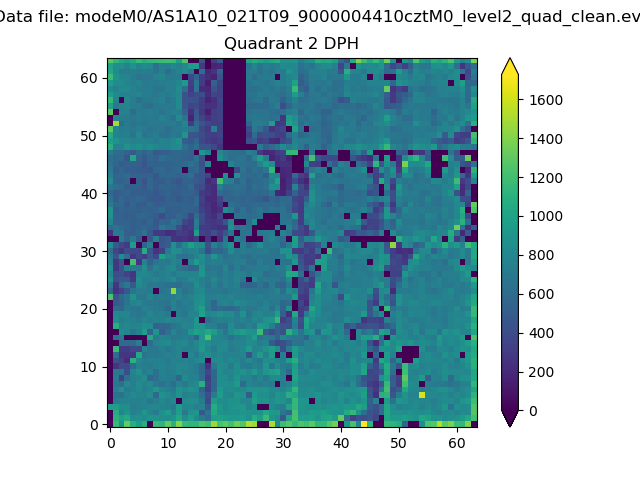
Histogram calculated using DETX and DETY for each event in the final _common_clean file
| Quadrant A |  |
 |
Quadrant B |
|---|---|---|---|
| Quadrant D |  |
 |
Quadrant C |
| Plot type | Count rate plots | Images |
|---|---|---|
| Comparison with Poisson distribution Blue bars denote a histogram of data divided into 1 sec bins. Red curve is a Poisson curve with rate = median count rate of data. |
 |
 |
| Quadrant-wise count rates Data is divided into 100 sec bins |
 |
|
| Module-wise count rates for Quadrant A Data is divided into 100 sec bins |
 |
 |
| Module-wise count rates for Quadrant B Data is divided into 100 sec bins |
 |
 |
| Module-wise count rates for Quadrant C Data is divided into 100 sec bins |
 |
 |
| Module-wise count rates for Quadrant D Data is divided into 100 sec bins |
 |
 |
| Parameter | Plot |
|---|---|
| CZT HV Monitor |  |
| D_VDD |  |
| Temperature 1 | 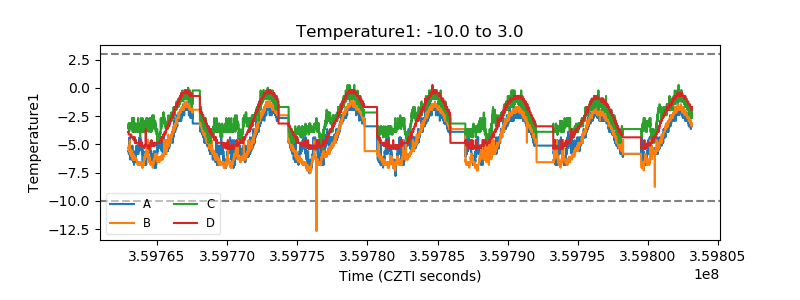 |
| Veto HV Monitor | 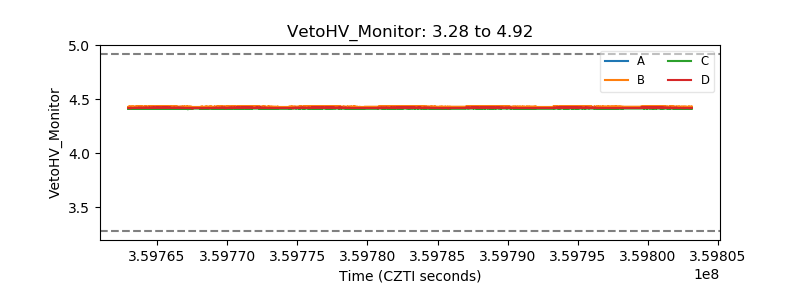 |
| Veto LLD |  |
| Alpha Counter |  |
| _CPM_Rate | 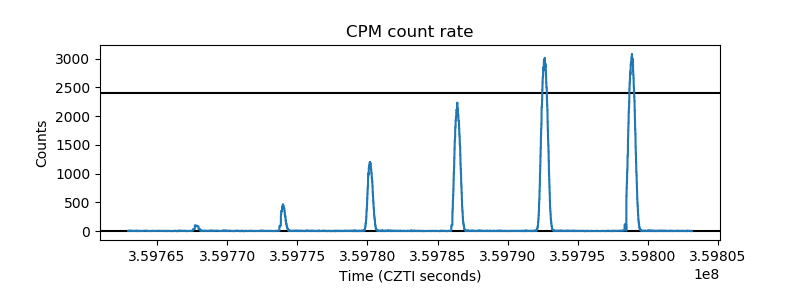 |
| CZT Counter |  |
| +2.5 Volts monitor |  |
| +5 Volts monitor |  |
| _ROLL_ROT |  |
| _Roll_DEC |  |
| _Roll_RA |  |
| Veto Counter |  |