| Param | Original file | Final file |
|---|---|---|
| Filename | modeM0/AS1A10_058T03_9000004408cztM0_level2_bc.evt | modeM0/AS1A10_058T03_9000004408cztM0_level2_quad_clean.evt |
| Size (bytes) | 4,744,543,680 | 1,185,439,680 |
| Size | 4.4 GB | 1.1 GB |
| Events in quadrant A | 20,399,971 | 7,875,659 |
| Events in quadrant B | 43,770,169 | 7,821,029 |
| Events in quadrant C | 21,356,081 | 7,107,722 |
| Events in quadrant D | 52,279,513 | 7,159,728 |
| Mode M0 | |||
|---|---|---|---|
| Quadrant | BADHDUFLAG | Total packets | Discarded packets |
| A | 0 | 187103 | 0 |
| B | 0 | 266840 | 0 |
| C | 0 | 205949 | 0 |
| D | 0 | 291550 | 0 |
| Mode SS | |||
|---|---|---|---|
| Quadrant | BADHDUFLAG | Total packets | Discarded packets |
| A | 0 | 1770 | 0 |
| B | 0 | 1770 | 0 |
| C | 0 | 1770 | 0 |
| D | 0 | 1770 | 0 |
| Mode M9 | |||
|---|---|---|---|
| Quadrant | BADHDUFLAG | Total packets | Discarded packets |
| A | 0 | 118 | 0 |
| B | 0 | 118 | 0 |
| C | 0 | 118 | 0 |
| D | 0 | 118 | 0 |
| Quadrant | Total seconds | Saturated seconds | Saturation percentage |
|---|---|---|---|
| A | 86633 | 1272 | 1.468263% |
| B | 86633 | 2253 | 2.600626% |
| C | 86633 | 10250 | 11.831519% |
| D | 86633 | 3261 | 3.764155% |
Noise dominated data is calculated using 1-second bins in cleaned event files. If a bin has >2000 counts, and if more than 50% of those come from <1% of pixels, then it is considered to be noise-dominated and hence unusable.
| Quadrant | # 1 sec bins | Bins with >0 counts | Bins with >2000 counts | High rate bins dominated by noise | Noise dominated (total time) | Noise dominated (detector-on time) | Marked lightcurve |
|---|---|---|---|---|---|---|---|
| A | 98633 | 86634 | 35 | 35 | 0.04% | 0.04% |  |
| B | 98633 | 86637 | 37 | 37 | 0.04% | 0.04% |  |
| C | 98633 | 86624 | 20 | 20 | 0.02% | 0.02% |  |
| D | 98633 | 86634 | 347 | 347 | 0.35% | 0.40% |  |
Top three noisy pixels from each quadrant. If the there are fewer than three noisy pixels in the level2.evt file, extra rows are filled as -1
| Pixel properties | Quadrant properties | ||||||
|---|---|---|---|---|---|---|---|
| Quadrant | DetID | PixID | Counts | Sigma | Mean | Median | Sigma |
| A | 0 | 13 | 1102009 | 1042.74 | 4944 | 4872 | 1052.2 |
| A | 8 | 192 | 159797 | 147.24 | 4944 | 4872 | 1052.2 |
| A | 13 | 254 | 146423 | 134.53 | 4944 | 4872 | 1052.2 |
| B | 6 | 159 | 23305717 | 25034.07 | 4930 | 4823 | 930.8 |
| B | 0 | 229 | 601101 | 640.63 | 4930 | 4823 | 930.8 |
| B | 4 | 171 | 286361 | 302.48 | 4930 | 4823 | 930.8 |
| C | 14 | 254 | 1314290 | 1262.22 | 4457 | 4460 | 1037.7 |
| C | 15 | 208 | 1238579 | 1189.27 | 4457 | 4460 | 1037.7 |
| C | 0 | 10 | 763328 | 731.29 | 4457 | 4460 | 1037.7 |
| D | 8 | 195 | 27320499 | 25553.41 | 4752 | 4612 | 1069.0 |
| D | 13 | 249 | 1528980 | 1426.01 | 4752 | 4612 | 1069.0 |
| D | 5 | 222 | 1515722 | 1413.61 | 4752 | 4612 | 1069.0 |
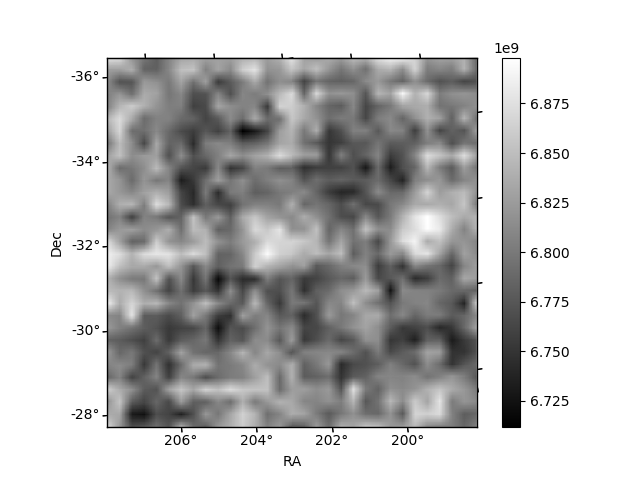
Histogram calculated using DETX and DETY for each event in the final _common_clean file
| Quadrant A |  |
 |
Quadrant B |
|---|---|---|---|
| Quadrant D |  |
 |
Quadrant C |
| Plot type | Count rate plots | Images |
|---|---|---|
| Comparison with Poisson distribution Blue bars denote a histogram of data divided into 1 sec bins. Red curve is a Poisson curve with rate = median count rate of data. |
 |
 |
| Quadrant-wise count rates Data is divided into 100 sec bins |
 |
|
| Module-wise count rates for Quadrant A Data is divided into 100 sec bins |
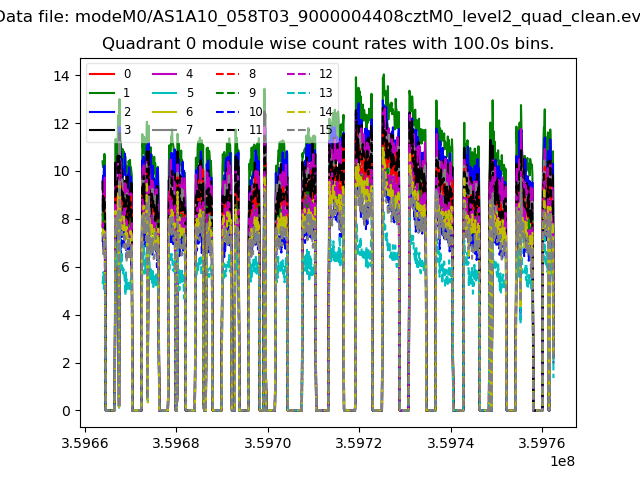 |
 |
| Module-wise count rates for Quadrant B Data is divided into 100 sec bins |
 |
 |
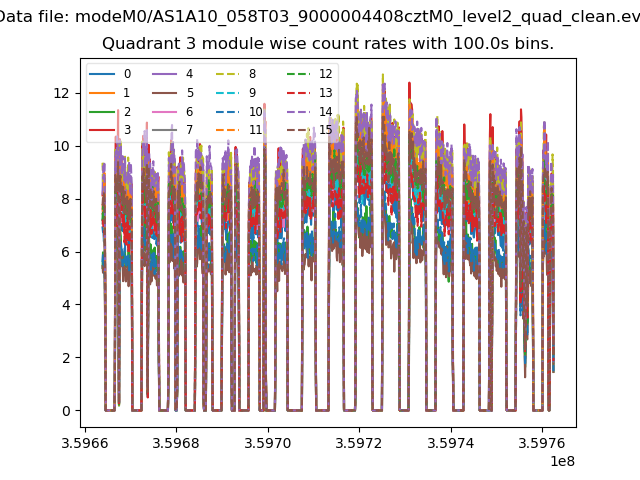
| Module-wise count rates for Quadrant C Data is divided into 100 sec bins |
 |
 |
| Module-wise count rates for Quadrant D Data is divided into 100 sec bins |
 |
 |
| Parameter | Plot |
|---|---|
| CZT HV Monitor |  |
| D_VDD |  |
| Temperature 1 |  |
| Veto HV Monitor |  |
| Veto LLD |  |
| Alpha Counter |  |
| _CPM_Rate |  |
| CZT Counter |  |
| +2.5 Volts monitor | 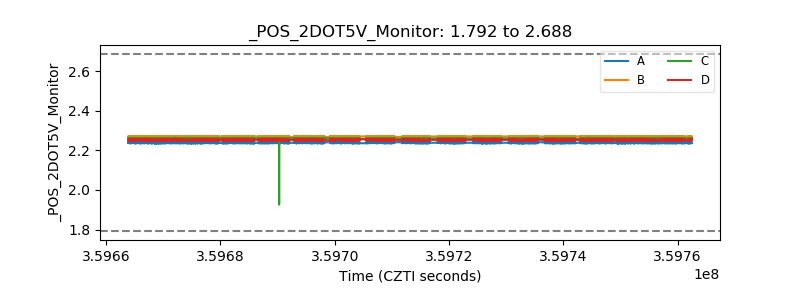 |
| +5 Volts monitor |  |
| _ROLL_ROT |  |
| _Roll_DEC | 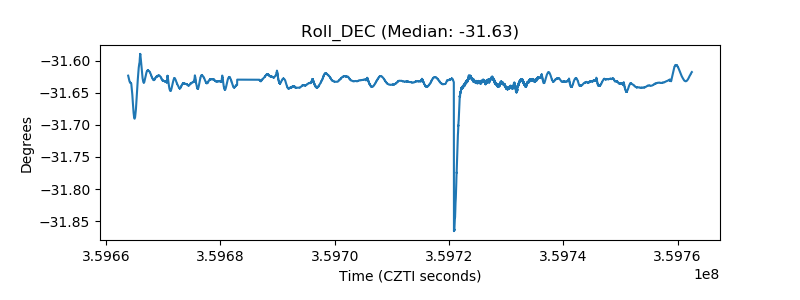 |
| _Roll_RA |  |
| Veto Counter |  |