| Param | Original file | Final file |
|---|---|---|
| Filename | modeM0/AS1A10_103T02_9000004406cztM0_level2_bc.evt | modeM0/AS1A10_103T02_9000004406cztM0_level2_quad_clean.evt |
| Size (bytes) | 2,854,560,960 | 807,655,680 |
| Size | 2.7 GB | 770.2 MB |
| Events in quadrant A | 14,156,810 | 5,325,832 |
| Events in quadrant B | 29,728,136 | 5,291,745 |
| Events in quadrant C | 13,936,916 | 5,016,104 |
| Events in quadrant D | 24,755,545 | 4,920,130 |
| Mode M9 | |||
|---|---|---|---|
| Quadrant | BADHDUFLAG | Total packets | Discarded packets |
| A | 0 | 109 | 0 |
| B | 0 | 109 | 0 |
| C | 0 | 109 | 0 |
| D | 0 | 109 | 0 |
| Mode SS | |||
|---|---|---|---|
| Quadrant | BADHDUFLAG | Total packets | Discarded packets |
| A | 0 | 1162 | 0 |
| B | 0 | 1162 | 0 |
| C | 0 | 1162 | 0 |
| D | 0 | 1162 | 0 |
| Mode M0 | |||
|---|---|---|---|
| Quadrant | BADHDUFLAG | Total packets | Discarded packets |
| A | 0 | 125081 | 0 |
| B | 0 | 177940 | 0 |
| C | 0 | 128384 | 0 |
| D | 0 | 158904 | 0 |
| Quadrant | Total seconds | Saturated seconds | Saturation percentage |
|---|---|---|---|
| A | 56990 | 1027 | 1.802071% |
| B | 56990 | 1699 | 2.981225% |
| C | 56990 | 2432 | 4.267415% |
| D | 56990 | 2159 | 3.788384% |
Noise dominated data is calculated using 1-second bins in cleaned event files. If a bin has >2000 counts, and if more than 50% of those come from <1% of pixels, then it is considered to be noise-dominated and hence unusable.
| Quadrant | # 1 sec bins | Bins with >0 counts | Bins with >2000 counts | High rate bins dominated by noise | Noise dominated (total time) | Noise dominated (detector-on time) | Marked lightcurve |
|---|---|---|---|---|---|---|---|
| A | 67915 | 56992 | 35 | 35 | 0.05% | 0.06% |  |
| B | 67915 | 56992 | 82 | 82 | 0.12% | 0.14% | 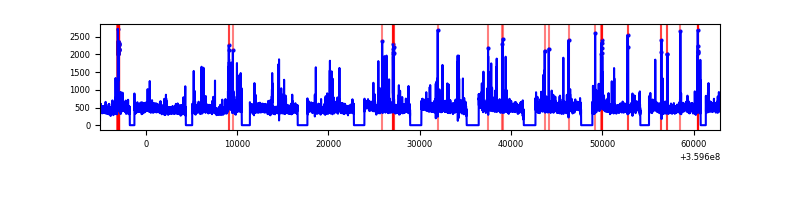 |
| C | 67915 | 56988 | 10 | 10 | 0.01% | 0.02% |  |
| D | 67915 | 56992 | 360 | 360 | 0.53% | 0.63% |  |
Top three noisy pixels from each quadrant. If the there are fewer than three noisy pixels in the level2.evt file, extra rows are filled as -1
| Pixel properties | Quadrant properties | ||||||
|---|---|---|---|---|---|---|---|
| Quadrant | DetID | PixID | Counts | Sigma | Mean | Median | Sigma |
| A | 0 | 13 | 1091165 | 1543.1 | 3327 | 3290 | 705.0 |
| A | 12 | 96 | 131807 | 182.3 | 3327 | 3290 | 705.0 |
| A | 8 | 192 | 111064 | 152.87 | 3327 | 3290 | 705.0 |
| B | 6 | 159 | 15266101 | 24829.03 | 3316 | 3255 | 614.7 |
| B | 0 | 229 | 531616 | 859.52 | 3316 | 3255 | 614.7 |
| B | 5 | 255 | 358589 | 578.04 | 3316 | 3255 | 614.7 |
| C | 0 | 10 | 767471 | 1046.14 | 3123 | 3128 | 730.6 |
| C | 3 | 233 | 670567 | 913.51 | 3123 | 3128 | 730.6 |
| C | 14 | 254 | 169697 | 227.98 | 3123 | 3128 | 730.6 |
| D | 8 | 195 | 5692255 | 7838.05 | 3225 | 3137 | 725.8 |
| D | 1 | 52 | 2226232 | 3062.82 | 3225 | 3137 | 725.8 |
| D | 12 | 227 | 996474 | 1368.55 | 3225 | 3137 | 725.8 |
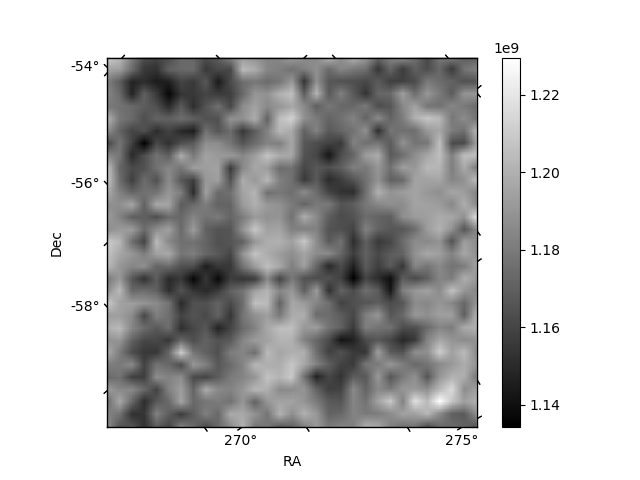
Histogram calculated using DETX and DETY for each event in the final _common_clean file
| Quadrant A |  |
 |
Quadrant B |
|---|---|---|---|
| Quadrant D |  |
 |
Quadrant C |
| Plot type | Count rate plots | Images |
|---|---|---|
| Comparison with Poisson distribution Blue bars denote a histogram of data divided into 1 sec bins. Red curve is a Poisson curve with rate = median count rate of data. |
 |
 |
| Quadrant-wise count rates Data is divided into 100 sec bins |
 |
|
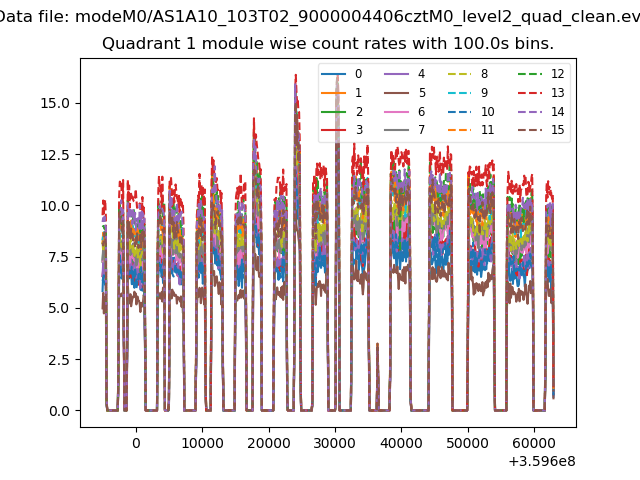
| Module-wise count rates for Quadrant A Data is divided into 100 sec bins |
 |
 |
| Module-wise count rates for Quadrant B Data is divided into 100 sec bins |
 |
 |
| Module-wise count rates for Quadrant C Data is divided into 100 sec bins |
 |
 |
| Module-wise count rates for Quadrant D Data is divided into 100 sec bins |
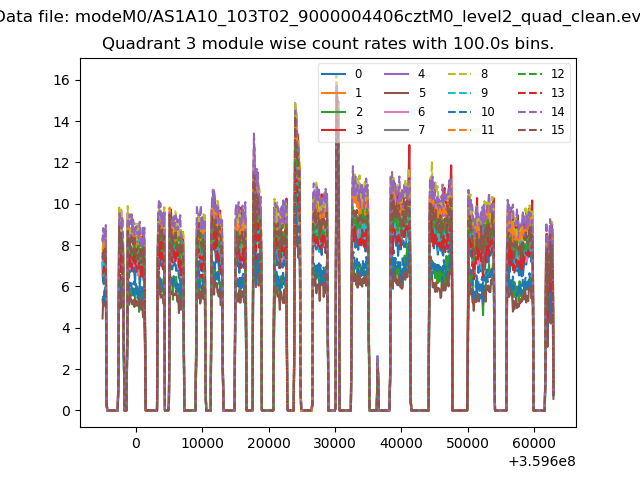 |
 |
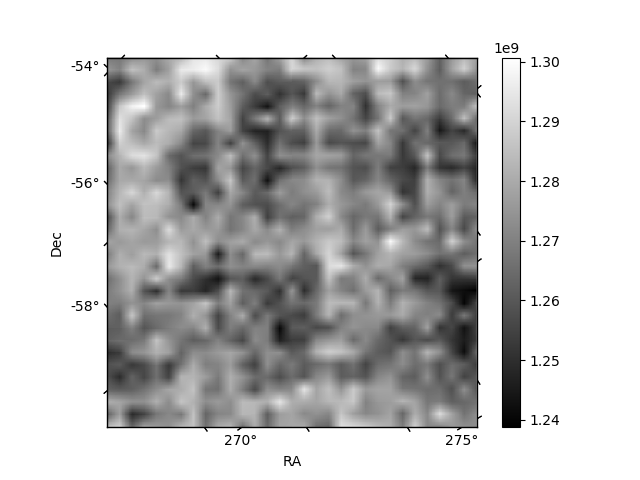
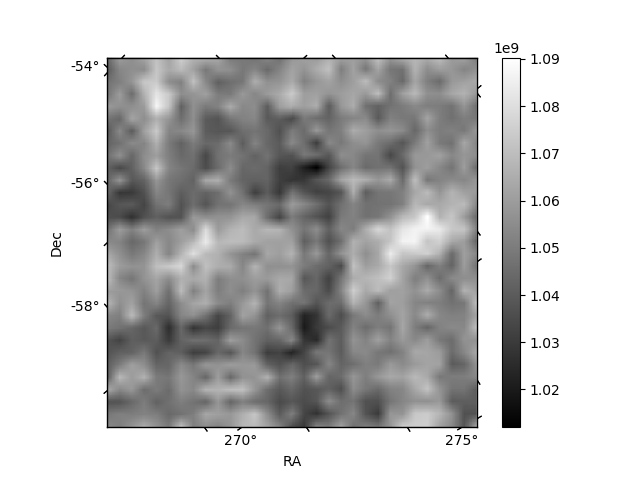
| Parameter | Plot |
|---|---|
| CZT HV Monitor | 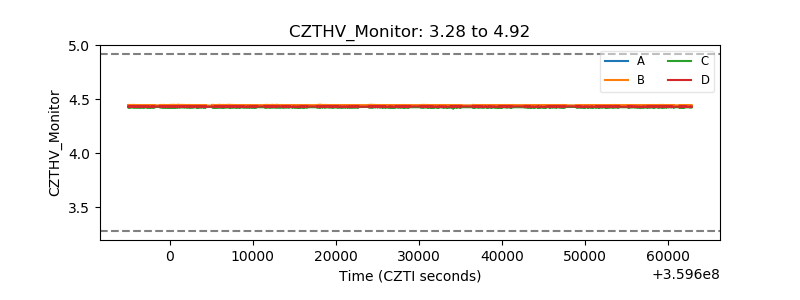 |
| D_VDD |  |
| Temperature 1 |  |
| Veto HV Monitor |  |
| Veto LLD | 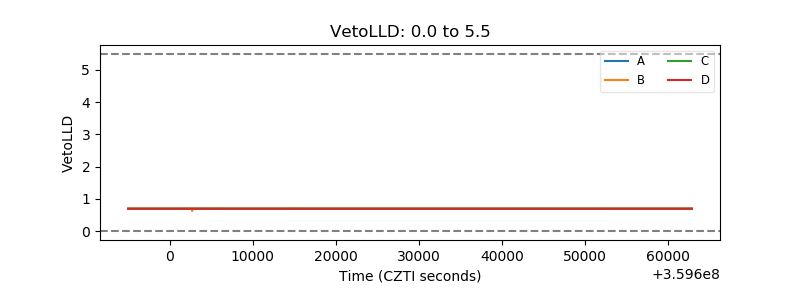 |
| Alpha Counter |  |
| _CPM_Rate |  |
| CZT Counter |  |
| +2.5 Volts monitor |  |
| +5 Volts monitor |  |
| _ROLL_ROT |  |
| _Roll_DEC |  |
| _Roll_RA |  |
| Veto Counter |  |