| Param | Original file | Final file |
|---|---|---|
| Filename | modeM0/AS1A10_053T23_9000004404cztM0_level2_bc.evt | modeM0/AS1A10_053T23_9000004404cztM0_level2_quad_clean.evt |
| Size (bytes) | 2,326,752,000 | 658,690,560 |
| Size | 2.2 GB | 628.2 MB |
| Events in quadrant A | 11,689,365 | 4,251,111 |
| Events in quadrant B | 25,430,809 | 4,208,625 |
| Events in quadrant C | 12,285,383 | 3,991,106 |
| Events in quadrant D | 17,588,329 | 3,999,247 |
| Mode SS | |||
|---|---|---|---|
| Quadrant | BADHDUFLAG | Total packets | Discarded packets |
| A | 0 | 1044 | 0 |
| B | 0 | 1044 | 0 |
| C | 0 | 1044 | 0 |
| D | 0 | 1044 | 0 |
| Mode M0 | |||
|---|---|---|---|
| Quadrant | BADHDUFLAG | Total packets | Discarded packets |
| A | 0 | 108814 | 0 |
| B | 0 | 157949 | 0 |
| C | 0 | 113748 | 0 |
| D | 0 | 127096 | 0 |
| Mode M9 | |||
|---|---|---|---|
| Quadrant | BADHDUFLAG | Total packets | Discarded packets |
| A | 0 | 88 | 0 |
| B | 0 | 88 | 0 |
| C | 0 | 88 | 0 |
| D | 0 | 88 | 0 |
| Quadrant | Total seconds | Saturated seconds | Saturation percentage |
|---|---|---|---|
| A | 51012 | 857 | 1.679997% |
| B | 51012 | 1763 | 3.456050% |
| C | 51012 | 2057 | 4.032385% |
| D | 51012 | 1681 | 3.295303% |
Noise dominated data is calculated using 1-second bins in cleaned event files. If a bin has >2000 counts, and if more than 50% of those come from <1% of pixels, then it is considered to be noise-dominated and hence unusable.
| Quadrant | # 1 sec bins | Bins with >0 counts | Bins with >2000 counts | High rate bins dominated by noise | Noise dominated (total time) | Noise dominated (detector-on time) | Marked lightcurve |
|---|---|---|---|---|---|---|---|
| A | 59917 | 51016 | 6 | 6 | 0.01% | 0.01% | 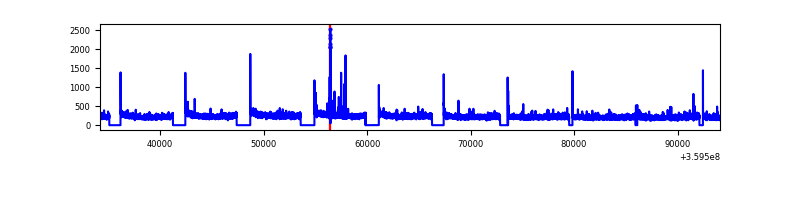 |
| B | 59917 | 51014 | 21 | 21 | 0.04% | 0.04% | 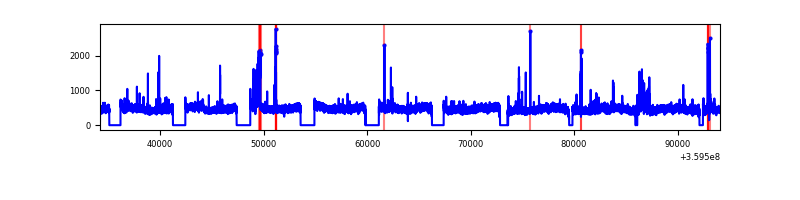 |
| C | 59917 | 51013 | 6 | 6 | 0.01% | 0.01% |  |
| D | 59917 | 51016 | 228 | 228 | 0.38% | 0.45% |  |
Top three noisy pixels from each quadrant. If the there are fewer than three noisy pixels in the level2.evt file, extra rows are filled as -1
| Pixel properties | Quadrant properties | ||||||
|---|---|---|---|---|---|---|---|
| Quadrant | DetID | PixID | Counts | Sigma | Mean | Median | Sigma |
| A | 12 | 96 | 118127 | 181.87 | 2967 | 2919 | 633.5 |
| A | 8 | 192 | 97882 | 149.91 | 2967 | 2919 | 633.5 |
| A | 13 | 254 | 87464 | 133.46 | 2967 | 2919 | 633.5 |
| B | 6 | 159 | 13388425 | 24271.17 | 2936 | 2869 | 551.5 |
| B | 6 | 36 | 673242 | 1215.54 | 2936 | 2869 | 551.5 |
| B | 0 | 190 | 43374 | 73.45 | 2936 | 2869 | 551.5 |
| C | 3 | 233 | 626429 | 964.38 | 2764 | 2759 | 646.7 |
| C | 0 | 10 | 464306 | 713.69 | 2764 | 2759 | 646.7 |
| C | 10 | 22 | 220571 | 336.8 | 2764 | 2759 | 646.7 |
| D | 1 | 52 | 2112898 | 3260.0 | 2892 | 2808 | 647.3 |
| D | 8 | 195 | 1581078 | 2438.36 | 2892 | 2808 | 647.3 |
| D | 5 | 222 | 965362 | 1487.1 | 2892 | 2808 | 647.3 |
Histogram calculated using DETX and DETY for each event in the final _common_clean file
| Quadrant A |  |
 |
Quadrant B |
|---|---|---|---|
| Quadrant D | 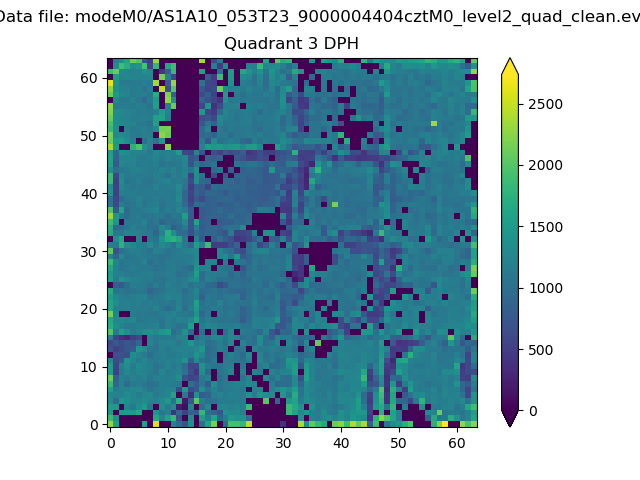 |
 |
Quadrant C |
| Plot type | Count rate plots | Images |
|---|---|---|
| Comparison with Poisson distribution Blue bars denote a histogram of data divided into 1 sec bins. Red curve is a Poisson curve with rate = median count rate of data. |
 |
 |
| Quadrant-wise count rates Data is divided into 100 sec bins |
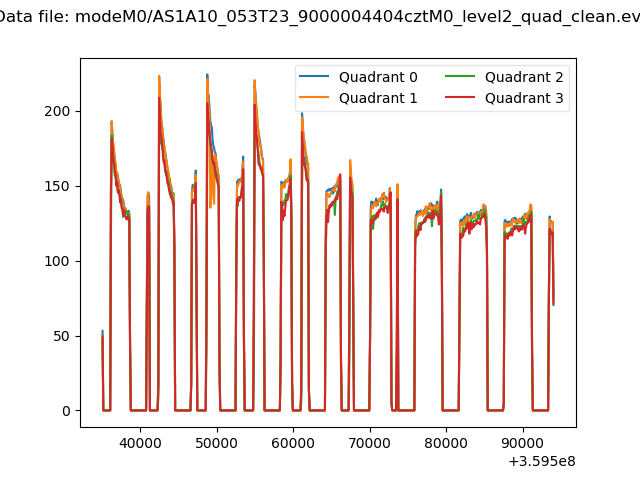 |
|
| Module-wise count rates for Quadrant A Data is divided into 100 sec bins |
 |
 |
| Module-wise count rates for Quadrant B Data is divided into 100 sec bins |
 |
 |
| Module-wise count rates for Quadrant C Data is divided into 100 sec bins |
 |
 |
| Module-wise count rates for Quadrant D Data is divided into 100 sec bins |
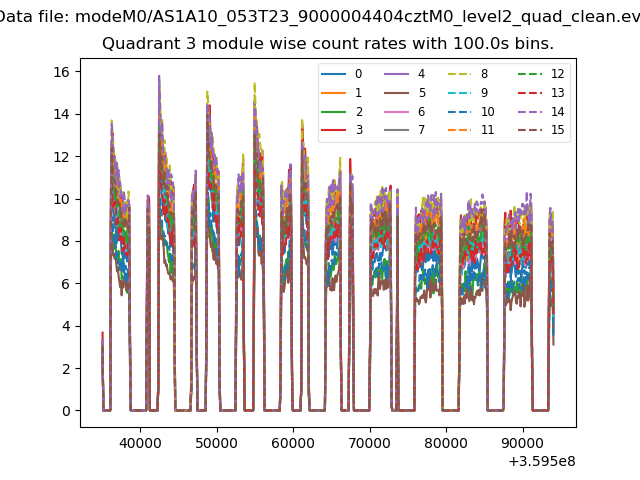 |
 |
| Parameter | Plot |
|---|---|
| CZT HV Monitor |  |
| D_VDD |  |
| Temperature 1 | 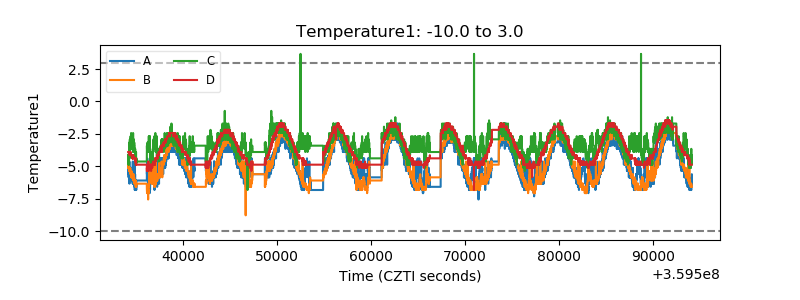 |
| Veto HV Monitor |  |
| Veto LLD | 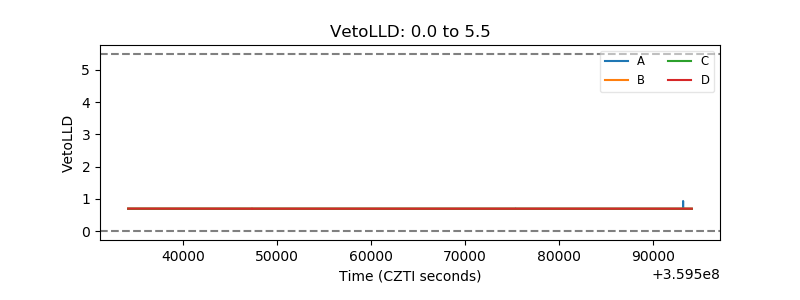 |
| Alpha Counter |  |
| _CPM_Rate |  |
| CZT Counter |  |
| +2.5 Volts monitor |  |
| +5 Volts monitor |  |
| _ROLL_ROT |  |
| _Roll_DEC |  |
| _Roll_RA |  |
| Veto Counter |  |