| Param | Original file | Final file |
|---|---|---|
| Filename | modeM0/AS1A10_053T20_9000004398cztM0_level2_bc.evt | modeM0/AS1A10_053T20_9000004398cztM0_level2_quad_clean.evt |
| Size (bytes) | 1,099,854,720 | 332,202,240 |
| Size | 1.0 GB | 316.8 MB |
| Events in quadrant A | 4,989,128 | 2,172,800 |
| Events in quadrant B | 12,324,502 | 2,141,910 |
| Events in quadrant C | 5,728,613 | 2,072,703 |
| Events in quadrant D | 8,601,795 | 1,996,383 |
| Mode M0 | |||
|---|---|---|---|
| Quadrant | BADHDUFLAG | Total packets | Discarded packets |
| A | 0 | 50175 | 0 |
| B | 0 | 74932 | 0 |
| C | 0 | 54000 | 0 |
| D | 0 | 63980 | 0 |
| Mode M9 | |||
|---|---|---|---|
| Quadrant | BADHDUFLAG | Total packets | Discarded packets |
| A | 0 | 14 | 0 |
| B | 0 | 14 | 0 |
| C | 0 | 14 | 0 |
| D | 0 | 14 | 0 |
| Mode SS | |||
|---|---|---|---|
| Quadrant | BADHDUFLAG | Total packets | Discarded packets |
| A | 0 | 498 | 0 |
| B | 0 | 498 | 0 |
| C | 0 | 498 | 0 |
| D | 0 | 498 | 0 |
| Quadrant | Total seconds | Saturated seconds | Saturation percentage |
|---|---|---|---|
| A | 24392 | 242 | 0.992129% |
| B | 24392 | 632 | 2.591013% |
| C | 24392 | 952 | 3.902919% |
| D | 24392 | 1457 | 5.973270% |
Noise dominated data is calculated using 1-second bins in cleaned event files. If a bin has >2000 counts, and if more than 50% of those come from <1% of pixels, then it is considered to be noise-dominated and hence unusable.
| Quadrant | # 1 sec bins | Bins with >0 counts | Bins with >2000 counts | High rate bins dominated by noise | Noise dominated (total time) | Noise dominated (detector-on time) | Marked lightcurve |
|---|---|---|---|---|---|---|---|
| A | 25822 | 24394 | 0 | 0 | 0.00% | 0.00% |  |
| B | 25822 | 24396 | 25 | 25 | 0.10% | 0.10% |  |
| C | 25822 | 24392 | 9 | 9 | 0.03% | 0.04% |  |
| D | 25822 | 24392 | 157 | 157 | 0.61% | 0.64% |  |
Top three noisy pixels from each quadrant. If the there are fewer than three noisy pixels in the level2.evt file, extra rows are filled as -1
| Pixel properties | Quadrant properties | ||||||
|---|---|---|---|---|---|---|---|
| Quadrant | DetID | PixID | Counts | Sigma | Mean | Median | Sigma |
| A | 8 | 192 | 70564 | 248.82 | 1273 | 1250 | 278.6 |
| A | 13 | 254 | 42835 | 149.28 | 1273 | 1250 | 278.6 |
| A | 0 | 226 | 7939 | 24.01 | 1273 | 1250 | 278.6 |
| B | 6 | 159 | 6812935 | 27832.1 | 1261 | 1229 | 244.7 |
| B | 6 | 36 | 377975 | 1539.35 | 1261 | 1229 | 244.7 |
| B | 4 | 171 | 152779 | 619.22 | 1261 | 1229 | 244.7 |
| C | 10 | 22 | 499641 | 1762.55 | 1192 | 1186 | 282.8 |
| C | 0 | 10 | 242384 | 852.88 | 1192 | 1186 | 282.8 |
| C | 3 | 233 | 189512 | 665.93 | 1192 | 1186 | 282.8 |
| D | 7 | 238 | 1251739 | 4439.4 | 1220 | 1180 | 281.7 |
| D | 1 | 52 | 1094571 | 3881.46 | 1220 | 1180 | 281.7 |
| D | 8 | 195 | 640603 | 2269.91 | 1220 | 1180 | 281.7 |
Histogram calculated using DETX and DETY for each event in the final _common_clean file
| Quadrant A |  |
 |
Quadrant B |
|---|---|---|---|
| Quadrant D |  |
 |
Quadrant C |
| Plot type | Count rate plots | Images |
|---|---|---|
| Comparison with Poisson distribution Blue bars denote a histogram of data divided into 1 sec bins. Red curve is a Poisson curve with rate = median count rate of data. |
 |
 |
| Quadrant-wise count rates Data is divided into 100 sec bins |
 |
|
| Module-wise count rates for Quadrant A Data is divided into 100 sec bins |
 |
 |
| Module-wise count rates for Quadrant B Data is divided into 100 sec bins |
 |
 |
| Module-wise count rates for Quadrant C Data is divided into 100 sec bins |
 |
 |
| Module-wise count rates for Quadrant D Data is divided into 100 sec bins |
 |
 |
| Parameter | Plot |
|---|---|
| CZT HV Monitor | 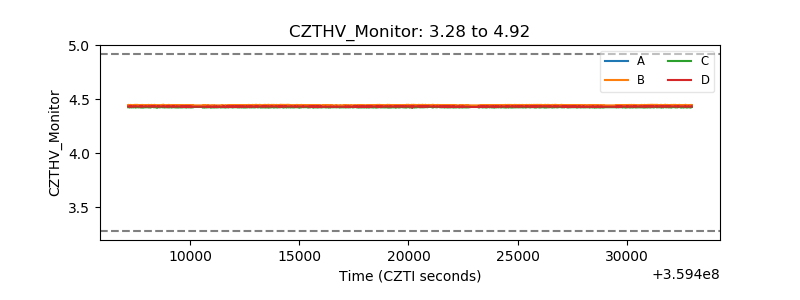 |
| D_VDD |  |
| Temperature 1 | 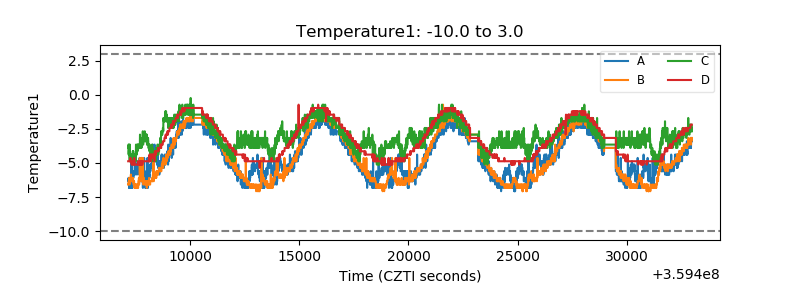 |
| Veto HV Monitor |  |
| Veto LLD |  |
| Alpha Counter |  |
| _CPM_Rate | 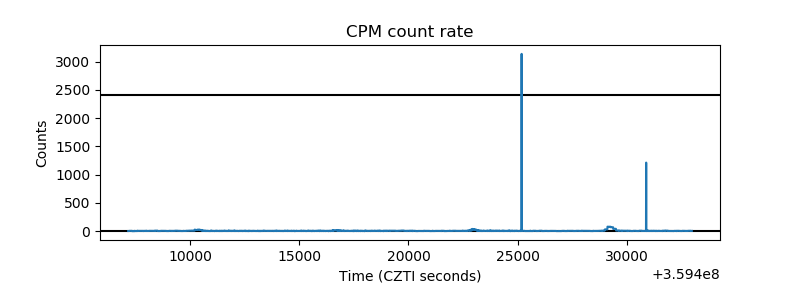 |
| CZT Counter |  |
| +2.5 Volts monitor |  |
| +5 Volts monitor |  |
| _ROLL_ROT |  |
| _Roll_DEC |  |
| _Roll_RA |  |
| Veto Counter |  |