| Param | Original file | Final file |
|---|---|---|
| Filename | modeM0/AS1A10_053T17_9000004396cztM0_level2_bc.evt | modeM0/AS1A10_053T17_9000004396cztM0_level2_quad_clean.evt |
| Size (bytes) | 1,162,175,040 | 293,290,560 |
| Size | 1.1 GB | 279.7 MB |
| Events in quadrant A | 5,525,551 | 1,914,795 |
| Events in quadrant B | 13,017,585 | 1,867,952 |
| Events in quadrant C | 6,354,237 | 1,748,522 |
| Events in quadrant D | 8,736,824 | 1,774,345 |
| Mode M9 | |||
|---|---|---|---|
| Quadrant | BADHDUFLAG | Total packets | Discarded packets |
| A | 0 | 58 | 0 |
| B | 0 | 58 | 0 |
| C | 0 | 58 | 0 |
| D | 0 | 58 | 0 |
| Mode SS | |||
|---|---|---|---|
| Quadrant | BADHDUFLAG | Total packets | Discarded packets |
| A | 0 | 470 | 0 |
| B | 0 | 470 | 0 |
| C | 0 | 470 | 0 |
| D | 0 | 470 | 0 |
| Mode M0 | |||
|---|---|---|---|
| Quadrant | BADHDUFLAG | Total packets | Discarded packets |
| A | 0 | 49406 | 0 |
| B | 0 | 76090 | 0 |
| C | 0 | 54091 | 0 |
| D | 0 | 59460 | 0 |
| Quadrant | Total seconds | Saturated seconds | Saturation percentage |
|---|---|---|---|
| A | 22907 | 373 | 1.628323% |
| B | 22907 | 1420 | 6.198978% |
| C | 22907 | 919 | 4.011874% |
| D | 22907 | 638 | 2.785175% |
Noise dominated data is calculated using 1-second bins in cleaned event files. If a bin has >2000 counts, and if more than 50% of those come from <1% of pixels, then it is considered to be noise-dominated and hence unusable.
| Quadrant | # 1 sec bins | Bins with >0 counts | Bins with >2000 counts | High rate bins dominated by noise | Noise dominated (total time) | Noise dominated (detector-on time) | Marked lightcurve |
|---|---|---|---|---|---|---|---|
| A | 28742 | 22906 | 0 | 0 | 0.00% | 0.00% | 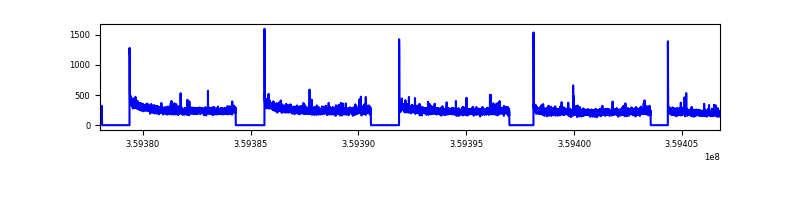 |
| B | 28742 | 22908 | 18 | 18 | 0.06% | 0.08% |  |
| C | 28742 | 22908 | 9 | 9 | 0.03% | 0.04% |  |
| D | 28742 | 22908 | 76 | 76 | 0.26% | 0.33% | 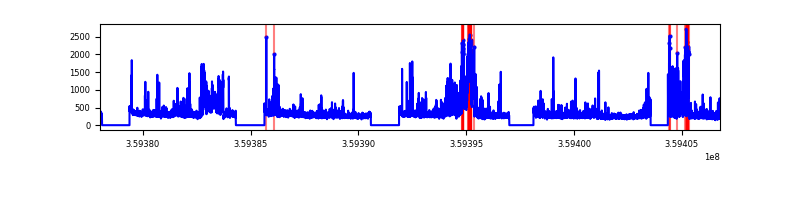 |
Top three noisy pixels from each quadrant. If the there are fewer than three noisy pixels in the level2.evt file, extra rows are filled as -1
| Pixel properties | Quadrant properties | ||||||
|---|---|---|---|---|---|---|---|
| Quadrant | DetID | PixID | Counts | Sigma | Mean | Median | Sigma |
| A | 8 | 192 | 57770 | 187.73 | 1419 | 1403 | 300.3 |
| A | 13 | 254 | 39208 | 125.91 | 1419 | 1403 | 300.3 |
| A | 0 | 226 | 9073 | 25.54 | 1419 | 1403 | 300.3 |
| B | 6 | 159 | 6034688 | 23420.85 | 1386 | 1362 | 257.6 |
| B | 6 | 36 | 1413586 | 5482.13 | 1386 | 1362 | 257.6 |
| B | 0 | 229 | 80131 | 305.77 | 1386 | 1362 | 257.6 |
| C | 0 | 10 | 546489 | 1832.78 | 1290 | 1290 | 297.5 |
| C | 3 | 233 | 406231 | 1361.28 | 1290 | 1290 | 297.5 |
| C | 10 | 22 | 385085 | 1290.19 | 1290 | 1290 | 297.5 |
| D | 12 | 227 | 1086101 | 3593.56 | 1362 | 1328 | 301.9 |
| D | 7 | 238 | 1027333 | 3398.87 | 1362 | 1328 | 301.9 |
| D | 8 | 195 | 891626 | 2949.31 | 1362 | 1328 | 301.9 |
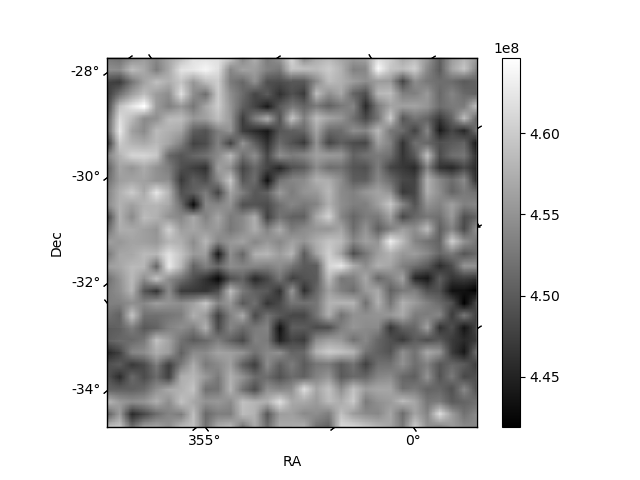
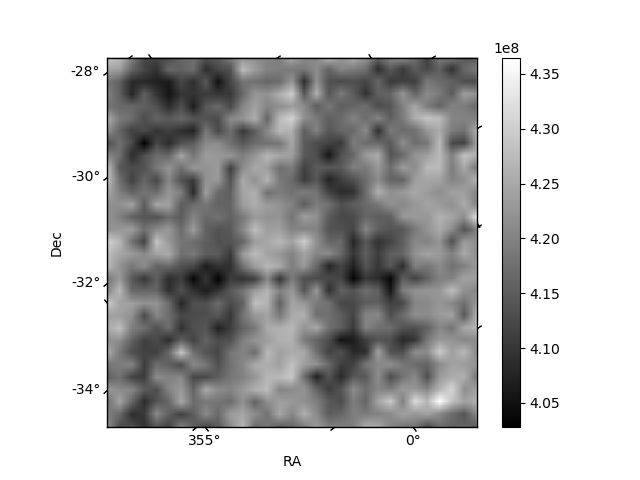
Histogram calculated using DETX and DETY for each event in the final _common_clean file
| Quadrant A | 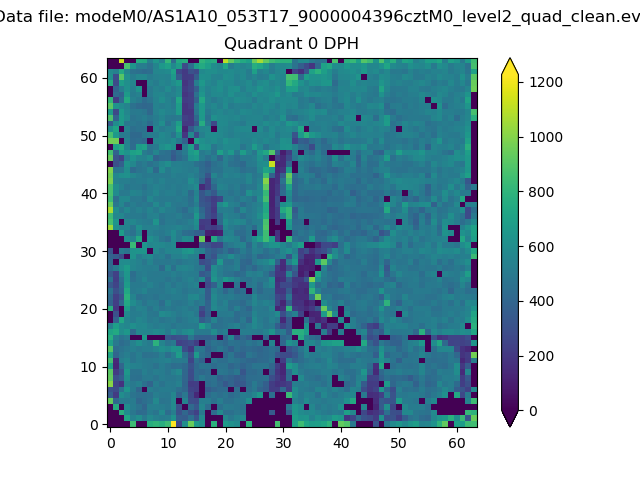 |
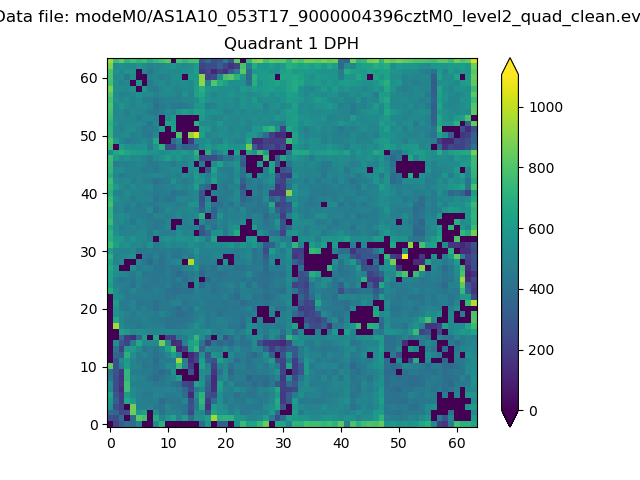 |
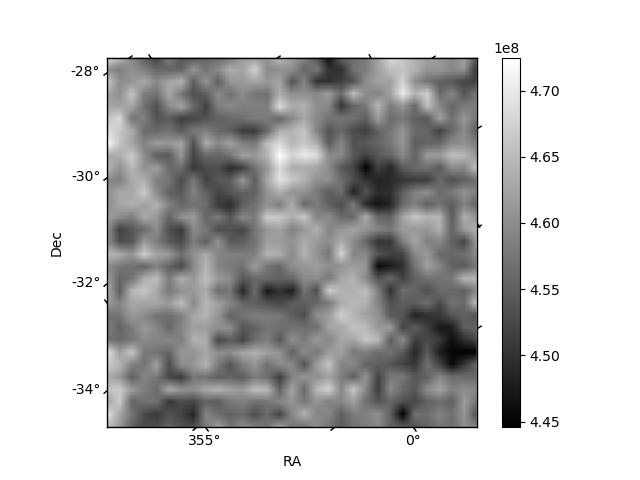
Quadrant B |
|---|---|---|---|
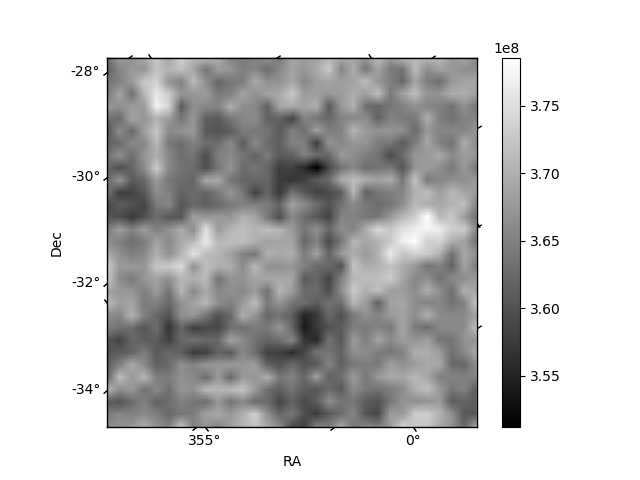
| Quadrant D |  |
 |
Quadrant C |
| Plot type | Count rate plots | Images |
|---|---|---|
| Comparison with Poisson distribution Blue bars denote a histogram of data divided into 1 sec bins. Red curve is a Poisson curve with rate = median count rate of data. |
 |
 |
| Quadrant-wise count rates Data is divided into 100 sec bins |
 |
|
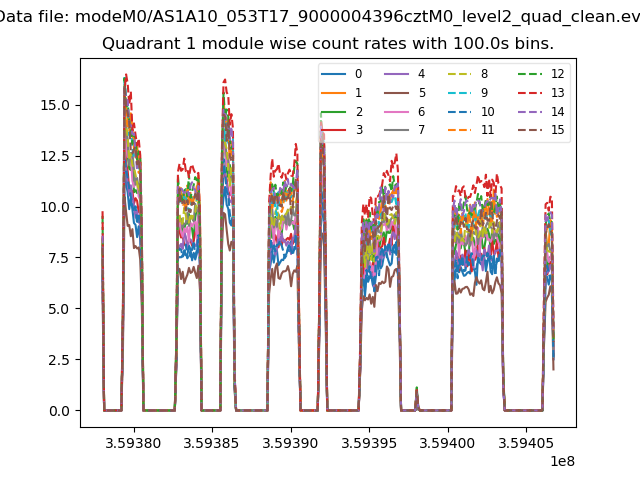
| Module-wise count rates for Quadrant A Data is divided into 100 sec bins |
 |
 |
| Module-wise count rates for Quadrant B Data is divided into 100 sec bins |
 |
 |
| Module-wise count rates for Quadrant C Data is divided into 100 sec bins |
 |
 |
| Module-wise count rates for Quadrant D Data is divided into 100 sec bins |
 |
 |
| Parameter | Plot |
|---|---|
| CZT HV Monitor |  |
| D_VDD |  |
| Temperature 1 |  |
| Veto HV Monitor |  |
| Veto LLD |  |
| Alpha Counter |  |
| _CPM_Rate | 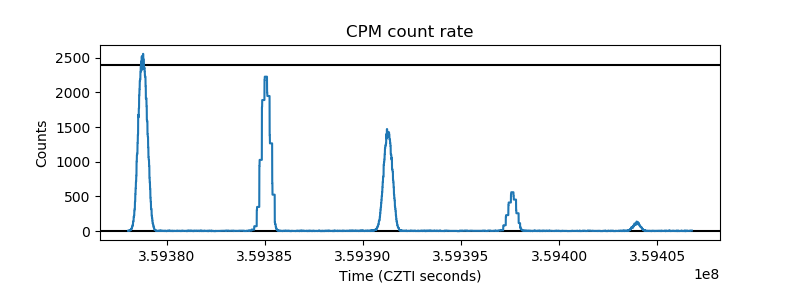 |
| CZT Counter |  |
| +2.5 Volts monitor |  |
| +5 Volts monitor |  |
| _ROLL_ROT | 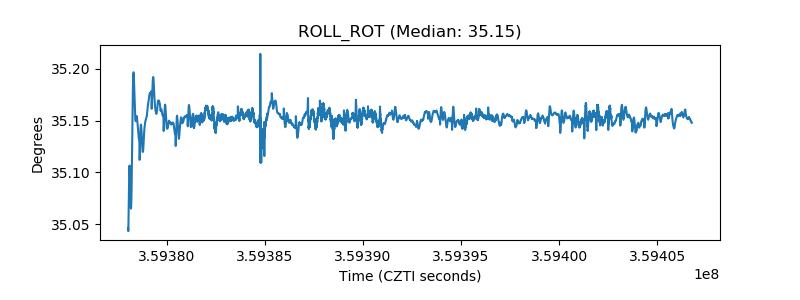 |
| _Roll_DEC |  |
| _Roll_RA |  |
| Veto Counter |  |