| Param | Original file | Final file |
|---|---|---|
| Filename | modeM0/AS1A10_053T14_9000004390cztM0_level2_bc.evt | modeM0/AS1A10_053T14_9000004390cztM0_level2_quad_clean.evt |
| Size (bytes) | 1,372,887,360 | 336,035,520 |
| Size | 1.3 GB | 320.5 MB |
| Events in quadrant A | 6,867,591 | 2,164,866 |
| Events in quadrant B | 14,811,993 | 2,116,076 |
| Events in quadrant C | 8,811,019 | 2,003,292 |
| Events in quadrant D | 9,252,813 | 2,041,174 |
| Mode M9 | |||
|---|---|---|---|
| Quadrant | BADHDUFLAG | Total packets | Discarded packets |
| A | 0 | 60 | 0 |
| B | 0 | 60 | 0 |
| C | 0 | 60 | 0 |
| D | 0 | 60 | 0 |
| Mode M0 | |||
|---|---|---|---|
| Quadrant | BADHDUFLAG | Total packets | Discarded packets |
| A | 0 | 59927 | 0 |
| B | 0 | 86066 | 0 |
| C | 0 | 69284 | 0 |
| D | 0 | 66018 | 0 |
| Mode SS | |||
|---|---|---|---|
| Quadrant | BADHDUFLAG | Total packets | Discarded packets |
| A | 0 | 548 | 0 |
| B | 0 | 548 | 0 |
| C | 0 | 548 | 0 |
| D | 0 | 548 | 0 |
| Quadrant | Total seconds | Saturated seconds | Saturation percentage |
|---|---|---|---|
| A | 26935 | 626 | 2.324114% |
| B | 26935 | 1001 | 3.716354% |
| C | 26935 | 1380 | 5.123445% |
| D | 26935 | 479 | 1.778355% |
Noise dominated data is calculated using 1-second bins in cleaned event files. If a bin has >2000 counts, and if more than 50% of those come from <1% of pixels, then it is considered to be noise-dominated and hence unusable.
| Quadrant | # 1 sec bins | Bins with >0 counts | Bins with >2000 counts | High rate bins dominated by noise | Noise dominated (total time) | Noise dominated (detector-on time) | Marked lightcurve |
|---|---|---|---|---|---|---|---|
| A | 32885 | 26936 | 46 | 46 | 0.14% | 0.17% |  |
| B | 32885 | 26937 | 75 | 75 | 0.23% | 0.28% |  |
| C | 32885 | 26936 | 60 | 60 | 0.18% | 0.22% |  |
| D | 32885 | 26937 | 61 | 61 | 0.19% | 0.23% |  |
Top three noisy pixels from each quadrant. If the there are fewer than three noisy pixels in the level2.evt file, extra rows are filled as -1
| Pixel properties | Quadrant properties | ||||||
|---|---|---|---|---|---|---|---|
| Quadrant | DetID | PixID | Counts | Sigma | Mean | Median | Sigma |
| A | 12 | 96 | 450619 | 1297.18 | 1640 | 1622 | 346.1 |
| A | 8 | 192 | 50284 | 140.59 | 1640 | 1622 | 346.1 |
| A | 13 | 254 | 46383 | 129.32 | 1640 | 1622 | 346.1 |
| B | 6 | 159 | 7132541 | 23538.76 | 1622 | 1593 | 302.9 |
| B | 6 | 36 | 1023204 | 3372.27 | 1622 | 1593 | 302.9 |
| B | 0 | 229 | 188855 | 618.14 | 1622 | 1593 | 302.9 |
| C | 3 | 233 | 1068498 | 3041.9 | 1510 | 1511 | 350.8 |
| C | 15 | 208 | 1057606 | 3010.85 | 1510 | 1511 | 350.8 |
| C | 10 | 22 | 690273 | 1963.61 | 1510 | 1511 | 350.8 |
| D | 8 | 195 | 1135352 | 3167.81 | 1599 | 1559 | 357.9 |
| D | 1 | 52 | 798566 | 2226.83 | 1599 | 1559 | 357.9 |
| D | 12 | 227 | 433025 | 1205.51 | 1599 | 1559 | 357.9 |
Histogram calculated using DETX and DETY for each event in the final _common_clean file
| Quadrant A |  |
 |
Quadrant B |
|---|---|---|---|
| Quadrant D |  |
 |
Quadrant C |
| Plot type | Count rate plots | Images |
|---|---|---|
| Comparison with Poisson distribution Blue bars denote a histogram of data divided into 1 sec bins. Red curve is a Poisson curve with rate = median count rate of data. |
 |
 |
| Quadrant-wise count rates Data is divided into 100 sec bins |
 |
|
| Module-wise count rates for Quadrant A Data is divided into 100 sec bins |
 |
 |
| Module-wise count rates for Quadrant B Data is divided into 100 sec bins |
 |
 |
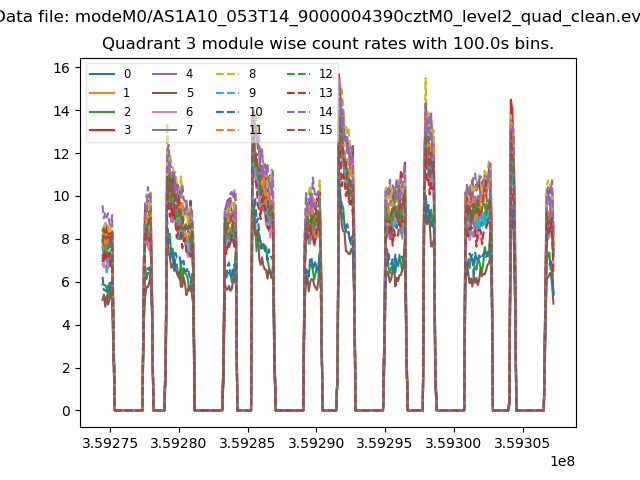
| Module-wise count rates for Quadrant C Data is divided into 100 sec bins |
 |
 |
| Module-wise count rates for Quadrant D Data is divided into 100 sec bins |
 |
 |
| Parameter | Plot |
|---|---|
| CZT HV Monitor |  |
| D_VDD |  |
| Temperature 1 |  |
| Veto HV Monitor |  |
| Veto LLD |  |
| Alpha Counter |  |
| _CPM_Rate |  |
| CZT Counter |  |
| +2.5 Volts monitor |  |
| +5 Volts monitor | 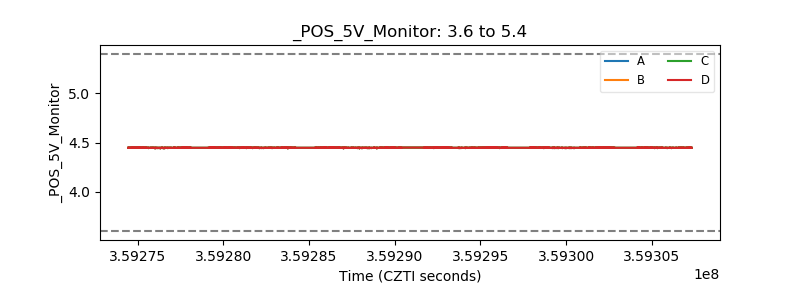 |
| _ROLL_ROT |  |
| _Roll_DEC |  |
| _Roll_RA |  |
| Veto Counter |  |