| Param | Original file | Final file |
|---|---|---|
| Filename | modeM0/AS1A10_053T13_9000004394cztM0_level2_bc.evt | modeM0/AS1A10_053T13_9000004394cztM0_level2_quad_clean.evt |
| Size (bytes) | 1,639,252,800 | 468,397,440 |
| Size | 1.5 GB | 446.7 MB |
| Events in quadrant A | 7,976,997 | 2,985,874 |
| Events in quadrant B | 18,874,644 | 2,949,339 |
| Events in quadrant C | 8,934,418 | 2,849,905 |
| Events in quadrant D | 11,321,083 | 2,842,542 |
| Mode M0 | |||
|---|---|---|---|
| Quadrant | BADHDUFLAG | Total packets | Discarded packets |
| A | 0 | 77170 | 0 |
| B | 0 | 114950 | 0 |
| C | 0 | 82261 | 0 |
| D | 0 | 85742 | 0 |
| Mode SS | |||
|---|---|---|---|
| Quadrant | BADHDUFLAG | Total packets | Discarded packets |
| A | 0 | 762 | 0 |
| B | 0 | 762 | 0 |
| C | 0 | 762 | 0 |
| D | 0 | 762 | 0 |
| Mode M9 | |||
|---|---|---|---|
| Quadrant | BADHDUFLAG | Total packets | Discarded packets |
| A | 0 | 49 | 0 |
| B | 0 | 49 | 0 |
| C | 0 | 49 | 0 |
| D | 0 | 49 | 0 |
| Quadrant | Total seconds | Saturated seconds | Saturation percentage |
|---|---|---|---|
| A | 37250 | 255 | 0.684564% |
| B | 37250 | 844 | 2.265772% |
| C | 37250 | 966 | 2.593289% |
| D | 37250 | 335 | 0.899329% |
Noise dominated data is calculated using 1-second bins in cleaned event files. If a bin has >2000 counts, and if more than 50% of those come from <1% of pixels, then it is considered to be noise-dominated and hence unusable.
| Quadrant | # 1 sec bins | Bins with >0 counts | Bins with >2000 counts | High rate bins dominated by noise | Noise dominated (total time) | Noise dominated (detector-on time) | Marked lightcurve |
|---|---|---|---|---|---|---|---|
| A | 42309 | 37253 | 0 | 0 | 0.00% | 0.00% |  |
| B | 42309 | 37249 | 112 | 112 | 0.26% | 0.30% | 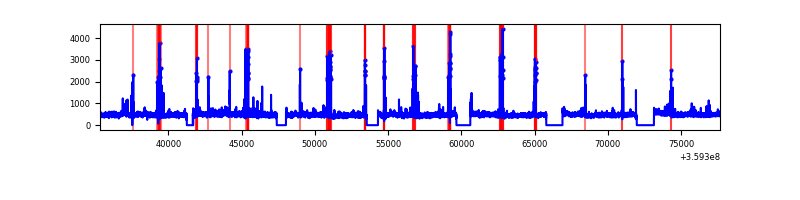 |
| C | 42309 | 37250 | 16 | 16 | 0.04% | 0.04% |  |
| D | 42309 | 37250 | 34 | 34 | 0.08% | 0.09% | 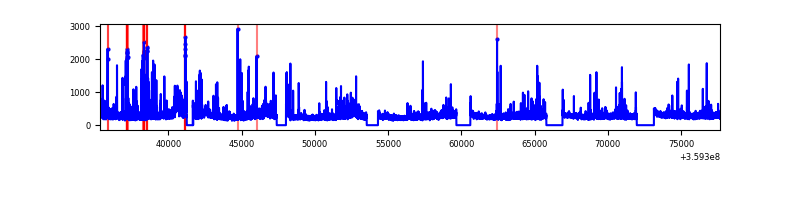 |
Top three noisy pixels from each quadrant. If the there are fewer than three noisy pixels in the level2.evt file, extra rows are filled as -1
| Pixel properties | Quadrant properties | ||||||
|---|---|---|---|---|---|---|---|
| Quadrant | DetID | PixID | Counts | Sigma | Mean | Median | Sigma |
| A | 8 | 192 | 82045 | 184.3 | 2026 | 1996 | 434.3 |
| A | 13 | 254 | 67390 | 150.56 | 2026 | 1996 | 434.3 |
| A | 12 | 96 | 55293 | 122.71 | 2026 | 1996 | 434.3 |
| B | 6 | 159 | 9999420 | 26232.01 | 2003 | 1958 | 381.1 |
| B | 4 | 171 | 565496 | 1478.65 | 2003 | 1958 | 381.1 |
| B | 0 | 229 | 323417 | 843.47 | 2003 | 1958 | 381.1 |
| C | 10 | 22 | 1155192 | 2553.76 | 1915 | 1906 | 451.6 |
| C | 3 | 233 | 227027 | 498.49 | 1915 | 1906 | 451.6 |
| C | 0 | 10 | 111818 | 243.38 | 1915 | 1906 | 451.6 |
| D | 8 | 195 | 1628193 | 3597.57 | 1995 | 1938 | 452.0 |
| D | 1 | 52 | 934075 | 2062.05 | 1995 | 1938 | 452.0 |
| D | 13 | 104 | 516730 | 1138.81 | 1995 | 1938 | 452.0 |
Histogram calculated using DETX and DETY for each event in the final _common_clean file
| Quadrant A |  |
 |
Quadrant B |
|---|---|---|---|
| Quadrant D | 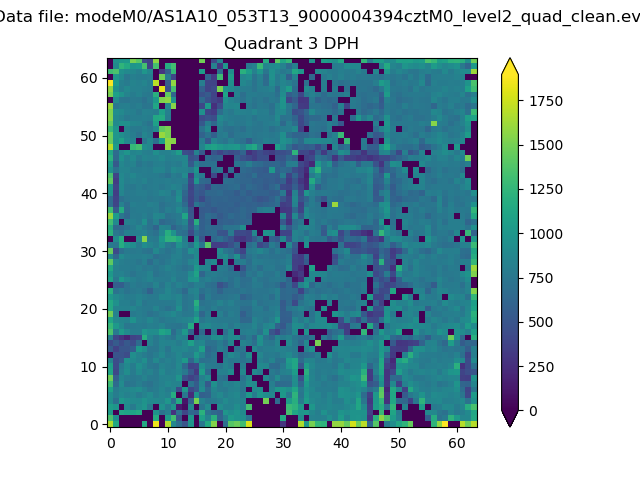 |
 |
Quadrant C |
| Plot type | Count rate plots | Images |
|---|---|---|
| Comparison with Poisson distribution Blue bars denote a histogram of data divided into 1 sec bins. Red curve is a Poisson curve with rate = median count rate of data. |
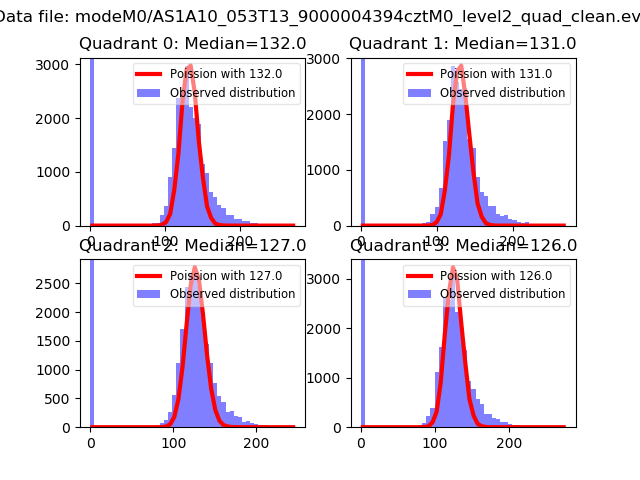 |
 |
| Quadrant-wise count rates Data is divided into 100 sec bins |
 |
|
| Module-wise count rates for Quadrant A Data is divided into 100 sec bins |
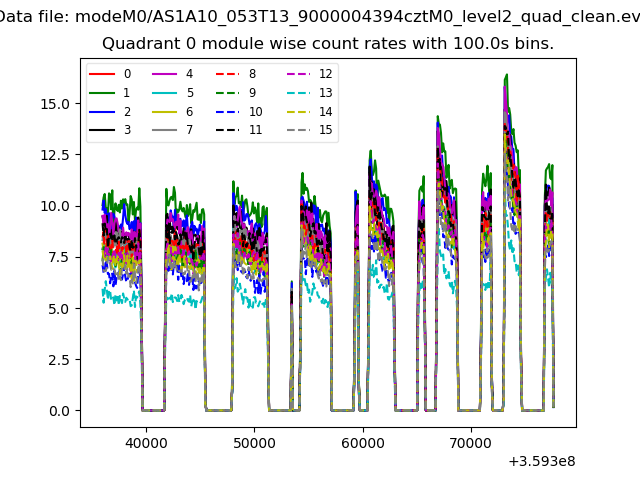 |
 |
| Module-wise count rates for Quadrant B Data is divided into 100 sec bins |
 |
 |
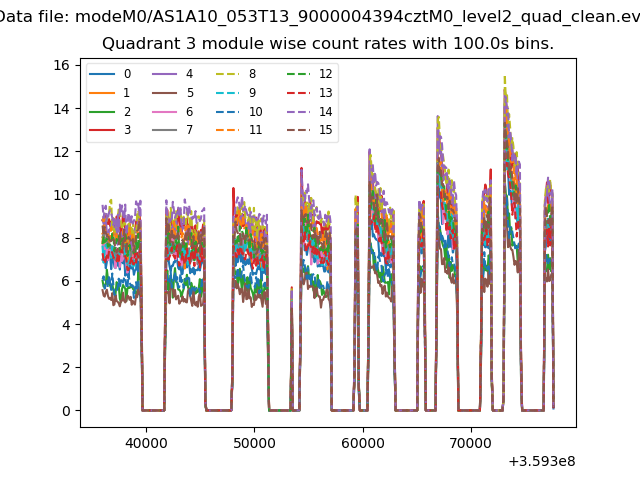
| Module-wise count rates for Quadrant C Data is divided into 100 sec bins |
 |
 |
| Module-wise count rates for Quadrant D Data is divided into 100 sec bins |
 |
 |
| Parameter | Plot |
|---|---|
| CZT HV Monitor |  |
| D_VDD |  |
| Temperature 1 | 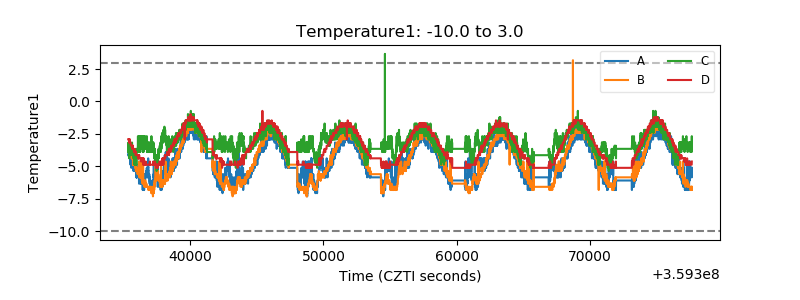 |
| Veto HV Monitor | 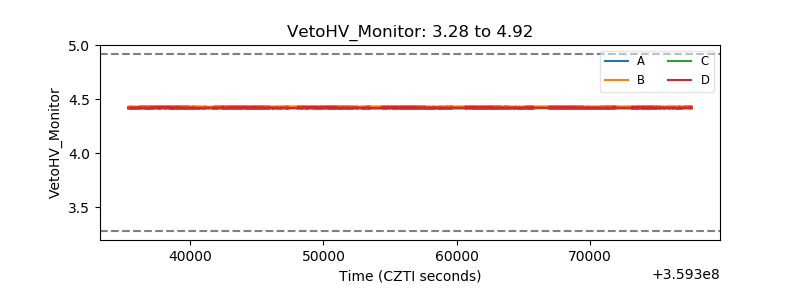 |
| Veto LLD |  |
| Alpha Counter |  |
| _CPM_Rate |  |
| CZT Counter |  |
| +2.5 Volts monitor |  |
| +5 Volts monitor |  |
| _ROLL_ROT | 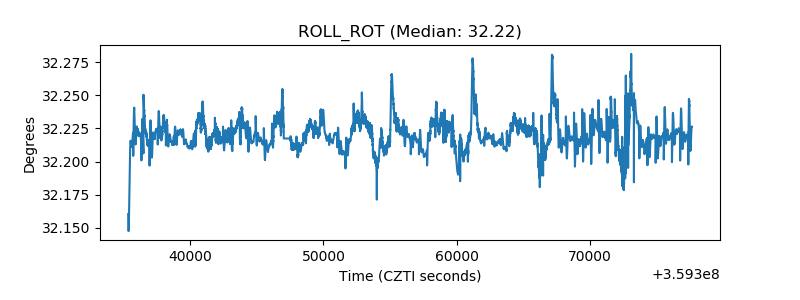 |
| _Roll_DEC |  |
| _Roll_RA |  |
| Veto Counter |  |