| Param | Original file | Final file |
|---|---|---|
| Filename | modeM0/AS1C05_019T04_9000004388cztM0_level2_bc.evt | modeM0/AS1C05_019T04_9000004388cztM0_level2_quad_clean.evt |
| Size (bytes) | 4,702,654,080 | 1,656,273,600 |
| Size | 4.4 GB | 1.5 GB |
| Events in quadrant A | 22,158,857 | 11,114,123 |
| Events in quadrant B | 53,282,515 | 10,945,418 |
| Events in quadrant C | 23,304,314 | 10,705,400 |
| Events in quadrant D | 36,716,043 | 10,387,284 |
| Mode M0 | |||
|---|---|---|---|
| Quadrant | BADHDUFLAG | Total packets | Discarded packets |
| A | 0 | 214322 | 0 |
| B | 0 | 320573 | 0 |
| C | 0 | 221286 | 0 |
| D | 0 | 265044 | 0 |
| Mode M9 | |||
|---|---|---|---|
| Quadrant | BADHDUFLAG | Total packets | Discarded packets |
| A | 0 | 141 | 0 |
| B | 0 | 141 | 0 |
| C | 0 | 141 | 0 |
| D | 0 | 141 | 0 |
| Mode SS | |||
|---|---|---|---|
| Quadrant | BADHDUFLAG | Total packets | Discarded packets |
| A | 0 | 2082 | 0 |
| B | 0 | 2082 | 0 |
| C | 0 | 2082 | 0 |
| D | 0 | 2082 | 0 |
| Quadrant | Total seconds | Saturated seconds | Saturation percentage |
|---|---|---|---|
| A | 102403 | 1027 | 1.002900% |
| B | 102403 | 3099 | 3.026279% |
| C | 102403 | 2661 | 2.598557% |
| D | 102403 | 4082 | 3.986211% |
Noise dominated data is calculated using 1-second bins in cleaned event files. If a bin has >2000 counts, and if more than 50% of those come from <1% of pixels, then it is considered to be noise-dominated and hence unusable.
| Quadrant | # 1 sec bins | Bins with >0 counts | Bins with >2000 counts | High rate bins dominated by noise | Noise dominated (total time) | Noise dominated (detector-on time) | Marked lightcurve |
|---|---|---|---|---|---|---|---|
| A | 116418 | 102408 | 12 | 12 | 0.01% | 0.01% | 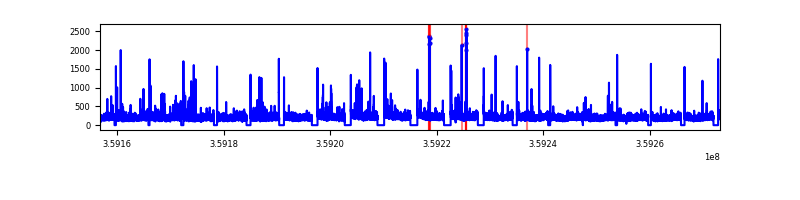 |
| B | 116418 | 102404 | 52 | 52 | 0.04% | 0.05% |  |
| C | 116418 | 102403 | 11 | 11 | 0.01% | 0.01% |  |
| D | 116418 | 102405 | 289 | 289 | 0.25% | 0.28% |  |
Top three noisy pixels from each quadrant. If the there are fewer than three noisy pixels in the level2.evt file, extra rows are filled as -1
| Pixel properties | Quadrant properties | ||||||
|---|---|---|---|---|---|---|---|
| Quadrant | DetID | PixID | Counts | Sigma | Mean | Median | Sigma |
| A | 12 | 96 | 537936 | 451.05 | 5497 | 5419 | 1180.6 |
| A | 8 | 192 | 216312 | 178.63 | 5497 | 5419 | 1180.6 |
| A | 13 | 254 | 182746 | 150.2 | 5497 | 5419 | 1180.6 |
| B | 6 | 159 | 28607938 | 27683.05 | 5454 | 5343 | 1033.2 |
| B | 0 | 229 | 1685923 | 1626.55 | 5454 | 5343 | 1033.2 |
| B | 6 | 36 | 540018 | 517.49 | 5454 | 5343 | 1033.2 |
| C | 3 | 233 | 1681250 | 1346.38 | 5265 | 5259 | 1244.8 |
| C | 10 | 22 | 870768 | 695.29 | 5265 | 5259 | 1244.8 |
| C | 2 | 114 | 197411 | 154.36 | 5265 | 5259 | 1244.8 |
| D | 8 | 195 | 6848242 | 5562.44 | 5342 | 5189 | 1230.2 |
| D | 12 | 218 | 2559660 | 2076.43 | 5342 | 5189 | 1230.2 |
| D | 2 | 250 | 2152908 | 1745.79 | 5342 | 5189 | 1230.2 |
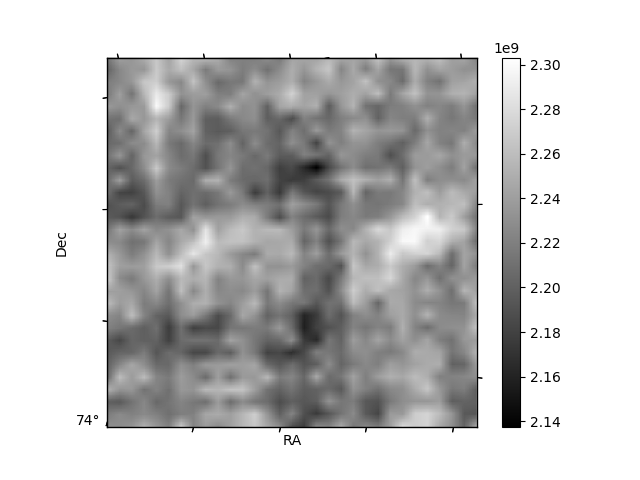
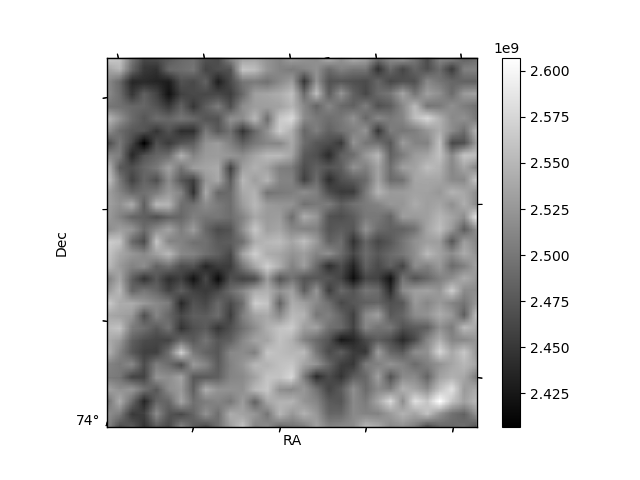
Histogram calculated using DETX and DETY for each event in the final _common_clean file
| Quadrant A |  |
 |
Quadrant B |
|---|---|---|---|
| Quadrant D |  |
 |
Quadrant C |
| Plot type | Count rate plots | Images |
|---|---|---|
| Comparison with Poisson distribution Blue bars denote a histogram of data divided into 1 sec bins. Red curve is a Poisson curve with rate = median count rate of data. |
 |
 |
| Quadrant-wise count rates Data is divided into 100 sec bins |
 |
|
| Module-wise count rates for Quadrant A Data is divided into 100 sec bins |
 |
 |
| Module-wise count rates for Quadrant B Data is divided into 100 sec bins |
 |
 |
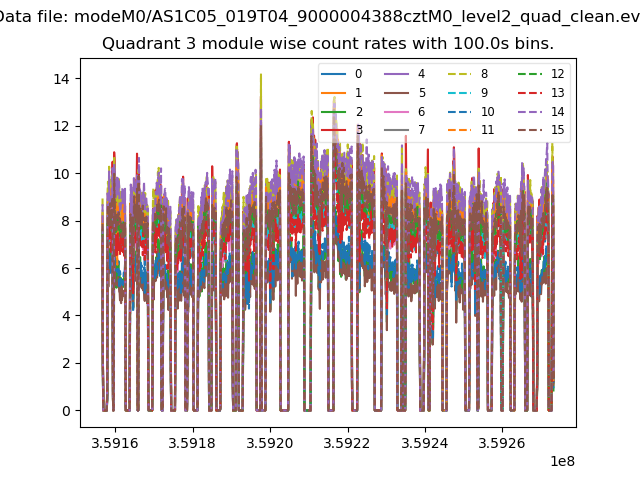
| Module-wise count rates for Quadrant C Data is divided into 100 sec bins |
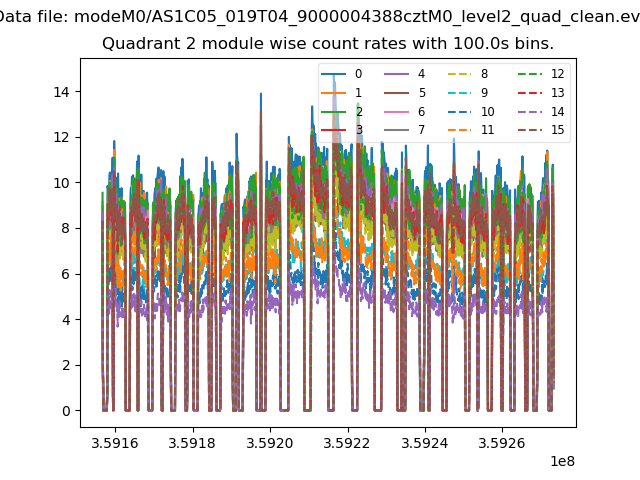 |
 |
| Module-wise count rates for Quadrant D Data is divided into 100 sec bins |
 |
 |
| Parameter | Plot |
|---|---|
| CZT HV Monitor |  |
| D_VDD |  |
| Temperature 1 |  |
| Veto HV Monitor |  |
| Veto LLD |  |
| Alpha Counter |  |
| _CPM_Rate |  |
| CZT Counter |  |
| +2.5 Volts monitor |  |
| +5 Volts monitor | 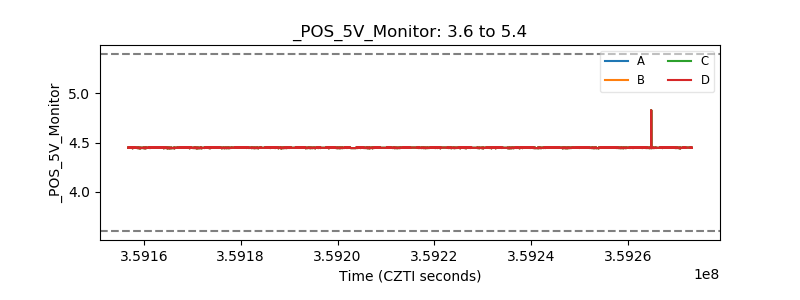 |
| _ROLL_ROT |  |
| _Roll_DEC |  |
| _Roll_RA |  |
| Veto Counter |  |