| Param | Original file | Final file |
|---|---|---|
| Filename | modeM0/AS1A10_053T47_9000004386cztM0_level2_bc.evt | modeM0/AS1A10_053T47_9000004386cztM0_level2_quad_clean.evt |
| Size (bytes) | 650,318,400 | 189,869,760 |
| Size | 620.2 MB | 181.1 MB |
| Events in quadrant A | 3,159,990 | 1,234,319 |
| Events in quadrant B | 7,331,568 | 1,220,594 |
| Events in quadrant C | 3,258,629 | 1,164,873 |
| Events in quadrant D | 4,979,570 | 1,157,407 |
| Mode SS | |||
|---|---|---|---|
| Quadrant | BADHDUFLAG | Total packets | Discarded packets |
| A | 0 | 288 | 0 |
| B | 0 | 288 | 0 |
| C | 0 | 288 | 0 |
| D | 0 | 288 | 0 |
| Mode M9 | |||
|---|---|---|---|
| Quadrant | BADHDUFLAG | Total packets | Discarded packets |
| A | 0 | 29 | 0 |
| B | 0 | 29 | 0 |
| C | 0 | 29 | 0 |
| D | 0 | 29 | 0 |
| Mode M0 | |||
|---|---|---|---|
| Quadrant | BADHDUFLAG | Total packets | Discarded packets |
| A | 0 | 29720 | 0 |
| B | 0 | 43678 | 0 |
| C | 0 | 30529 | 0 |
| D | 0 | 34753 | 0 |
| Quadrant | Total seconds | Saturated seconds | Saturation percentage |
|---|---|---|---|
| A | 14098 | 261 | 1.851326% |
| B | 14098 | 463 | 3.284154% |
| C | 14098 | 398 | 2.823095% |
| D | 14098 | 274 | 1.943538% |
Noise dominated data is calculated using 1-second bins in cleaned event files. If a bin has >2000 counts, and if more than 50% of those come from <1% of pixels, then it is considered to be noise-dominated and hence unusable.
| Quadrant | # 1 sec bins | Bins with >0 counts | Bins with >2000 counts | High rate bins dominated by noise | Noise dominated (total time) | Noise dominated (detector-on time) | Marked lightcurve |
|---|---|---|---|---|---|---|---|
| A | 16988 | 14098 | 0 | 0 | 0.00% | 0.00% |  |
| B | 16988 | 14098 | 3 | 3 | 0.02% | 0.02% |  |
| C | 16988 | 14098 | 2 | 2 | 0.01% | 0.01% |  |
| D | 16988 | 14098 | 45 | 45 | 0.26% | 0.32% |  |
Top three noisy pixels from each quadrant. If the there are fewer than three noisy pixels in the level2.evt file, extra rows are filled as -1
| Pixel properties | Quadrant properties | ||||||
|---|---|---|---|---|---|---|---|
| Quadrant | DetID | PixID | Counts | Sigma | Mean | Median | Sigma |
| A | 8 | 192 | 37838 | 216.13 | 800 | 786 | 171.4 |
| A | 12 | 96 | 25901 | 146.5 | 800 | 786 | 171.4 |
| A | 13 | 254 | 25488 | 144.09 | 800 | 786 | 171.4 |
| B | 6 | 159 | 3921442 | 25890.74 | 795 | 780 | 151.4 |
| B | 0 | 229 | 293613 | 1933.77 | 795 | 780 | 151.4 |
| B | 0 | 230 | 19832 | 125.81 | 795 | 780 | 151.4 |
| C | 10 | 22 | 163388 | 921.72 | 749 | 746 | 176.5 |
| C | 0 | 10 | 124021 | 698.62 | 749 | 746 | 176.5 |
| C | 3 | 233 | 59408 | 332.45 | 749 | 746 | 176.5 |
| D | 12 | 227 | 947496 | 5302.37 | 778 | 752 | 178.6 |
| D | 8 | 195 | 735652 | 4115.91 | 778 | 752 | 178.6 |
| D | 2 | 250 | 88089 | 489.14 | 778 | 752 | 178.6 |
Histogram calculated using DETX and DETY for each event in the final _common_clean file
| Quadrant A | 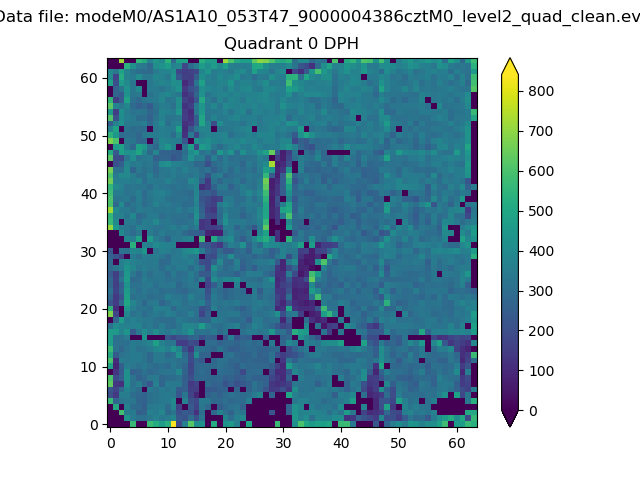 |
 |
Quadrant B |
|---|---|---|---|
| Quadrant D | 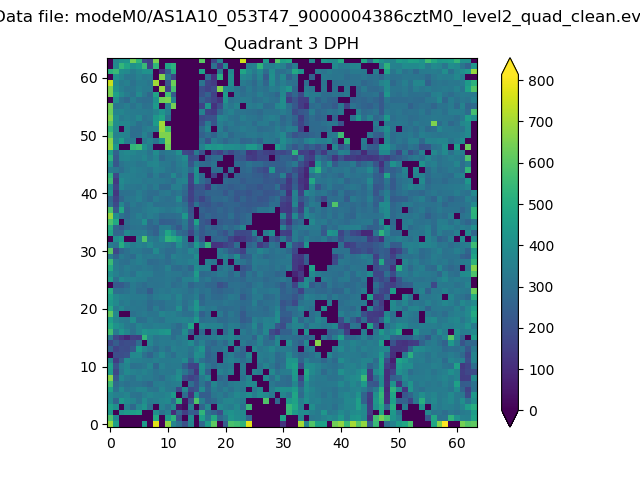 |
 |
Quadrant C |
| Plot type | Count rate plots | Images |
|---|---|---|
| Comparison with Poisson distribution Blue bars denote a histogram of data divided into 1 sec bins. Red curve is a Poisson curve with rate = median count rate of data. |
 |
 |
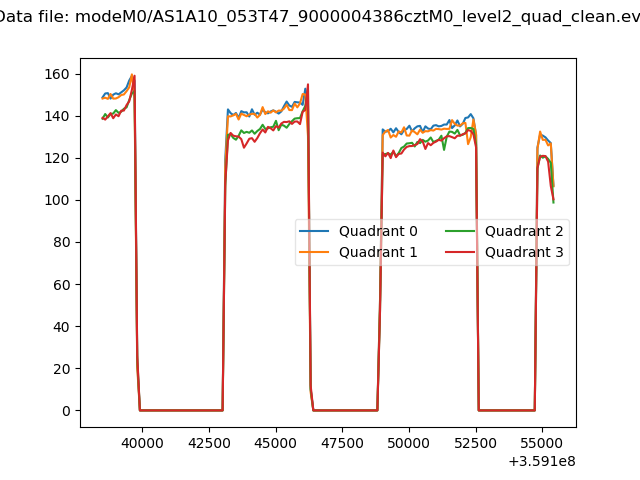
| Quadrant-wise count rates Data is divided into 100 sec bins |
 |
|
| Module-wise count rates for Quadrant A Data is divided into 100 sec bins |
 |
 |
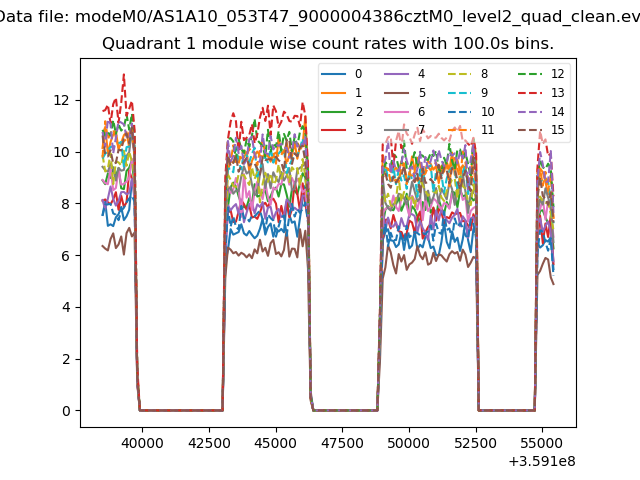
| Module-wise count rates for Quadrant B Data is divided into 100 sec bins |
 |
 |
| Module-wise count rates for Quadrant C Data is divided into 100 sec bins |
 |
 |
| Module-wise count rates for Quadrant D Data is divided into 100 sec bins |
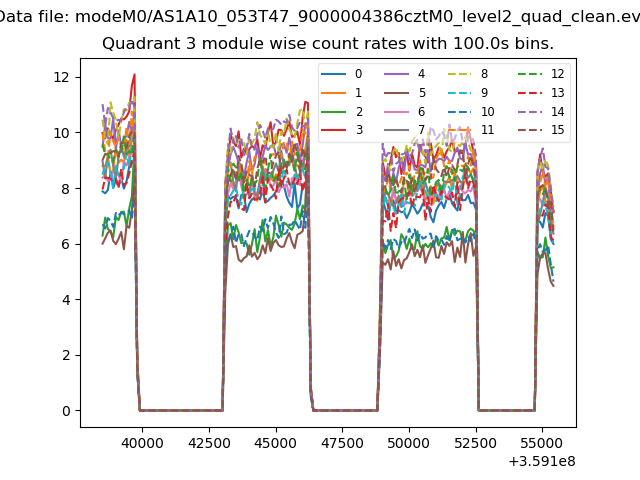 |
 |
| Parameter | Plot |
|---|---|
| CZT HV Monitor | 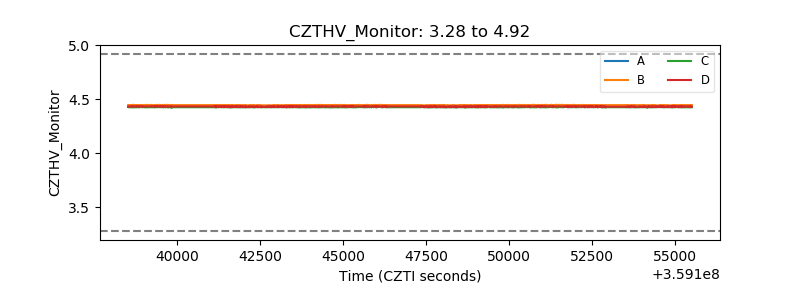 |
| D_VDD |  |
| Temperature 1 |  |
| Veto HV Monitor | 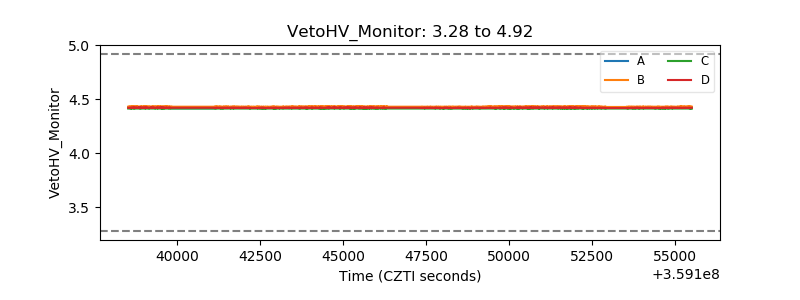 |
| Veto LLD |  |
| Alpha Counter |  |
| _CPM_Rate |  |
| CZT Counter |  |
| +2.5 Volts monitor |  |
| +5 Volts monitor | 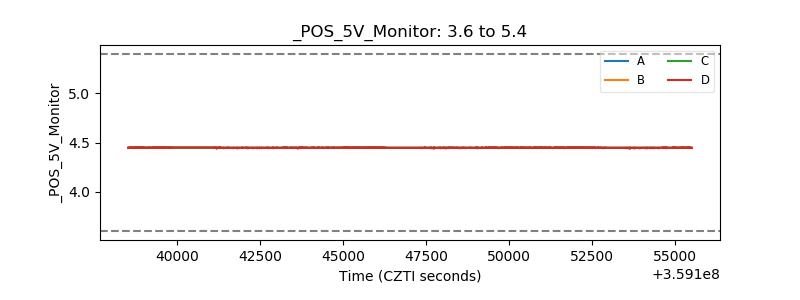 |
| _ROLL_ROT |  |
| _Roll_DEC |  |
| _Roll_RA | 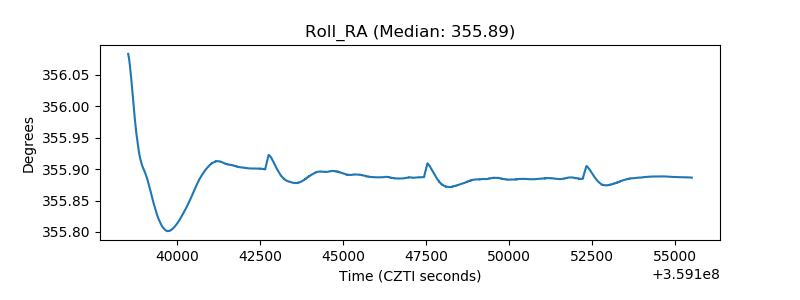 |
| Veto Counter |  |