| Param | Original file | Final file |
|---|---|---|
| Filename | modeM0/AS1A10_053T22_9000004384cztM0_level2_bc.evt | modeM0/AS1A10_053T22_9000004384cztM0_level2_quad_clean.evt |
| Size (bytes) | 1,207,307,520 | 297,109,440 |
| Size | 1.1 GB | 283.3 MB |
| Events in quadrant A | 6,008,885 | 1,941,928 |
| Events in quadrant B | 11,836,802 | 1,937,115 |
| Events in quadrant C | 6,446,255 | 1,808,079 |
| Events in quadrant D | 10,684,244 | 1,709,280 |
| Mode M9 | |||
|---|---|---|---|
| Quadrant | BADHDUFLAG | Total packets | Discarded packets |
| A | 0 | 57 | 0 |
| B | 0 | 57 | 0 |
| C | 0 | 57 | 0 |
| D | 0 | 57 | 0 |
| Mode SS | |||
|---|---|---|---|
| Quadrant | BADHDUFLAG | Total packets | Discarded packets |
| A | 0 | 472 | 0 |
| B | 0 | 472 | 0 |
| C | 0 | 472 | 0 |
| D | 0 | 472 | 0 |
| Mode M0 | |||
|---|---|---|---|
| Quadrant | BADHDUFLAG | Total packets | Discarded packets |
| A | 0 | 51249 | 0 |
| B | 0 | 71455 | 0 |
| C | 0 | 54471 | 0 |
| D | 0 | 75082 | 0 |
| Quadrant | Total seconds | Saturated seconds | Saturation percentage |
|---|---|---|---|
| A | 23276 | 308 | 1.323251% |
| B | 23276 | 397 | 1.705620% |
| C | 23276 | 617 | 2.650799% |
| D | 23276 | 2453 | 10.538752% |
Noise dominated data is calculated using 1-second bins in cleaned event files. If a bin has >2000 counts, and if more than 50% of those come from <1% of pixels, then it is considered to be noise-dominated and hence unusable.
| Quadrant | # 1 sec bins | Bins with >0 counts | Bins with >2000 counts | High rate bins dominated by noise | Noise dominated (total time) | Noise dominated (detector-on time) | Marked lightcurve |
|---|---|---|---|---|---|---|---|
| A | 28250 | 23277 | 38 | 38 | 0.13% | 0.16% |  |
| B | 28251 | 23277 | 1 | 1 | 0.00% | 0.00% |  |
| C | 28250 | 23275 | 6 | 6 | 0.02% | 0.03% | 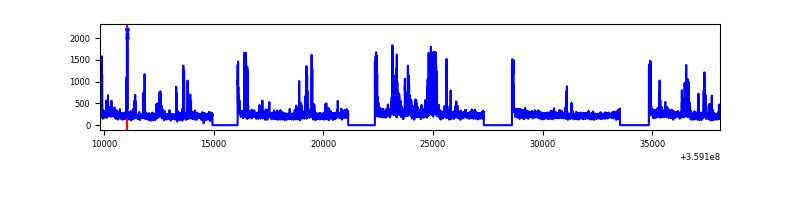 |
| D | 28250 | 23276 | 56 | 56 | 0.20% | 0.24% |  |
Top three noisy pixels from each quadrant. If the there are fewer than three noisy pixels in the level2.evt file, extra rows are filled as -1
| Pixel properties | Quadrant properties | ||||||
|---|---|---|---|---|---|---|---|
| Quadrant | DetID | PixID | Counts | Sigma | Mean | Median | Sigma |
| A | 4 | 2 | 307531 | 1008.3 | 1445 | 1431 | 303.6 |
| A | 12 | 96 | 54320 | 174.22 | 1445 | 1431 | 303.6 |
| A | 8 | 192 | 52873 | 169.45 | 1445 | 1431 | 303.6 |
| B | 6 | 159 | 6025280 | 22572.01 | 1436 | 1412 | 266.9 |
| B | 0 | 229 | 222870 | 829.82 | 1436 | 1412 | 266.9 |
| B | 0 | 230 | 47954 | 174.4 | 1436 | 1412 | 266.9 |
| C | 10 | 22 | 606441 | 1957.21 | 1334 | 1336 | 309.2 |
| C | 3 | 233 | 395206 | 1273.97 | 1334 | 1336 | 309.2 |
| C | 0 | 10 | 231318 | 743.88 | 1334 | 1336 | 309.2 |
| D | 13 | 104 | 2331246 | 8015.5 | 1316 | 1280 | 290.7 |
| D | 12 | 218 | 1047050 | 3597.64 | 1316 | 1280 | 290.7 |
| D | 8 | 195 | 1030381 | 3540.29 | 1316 | 1280 | 290.7 |
Histogram calculated using DETX and DETY for each event in the final _common_clean file
| Quadrant A |  |
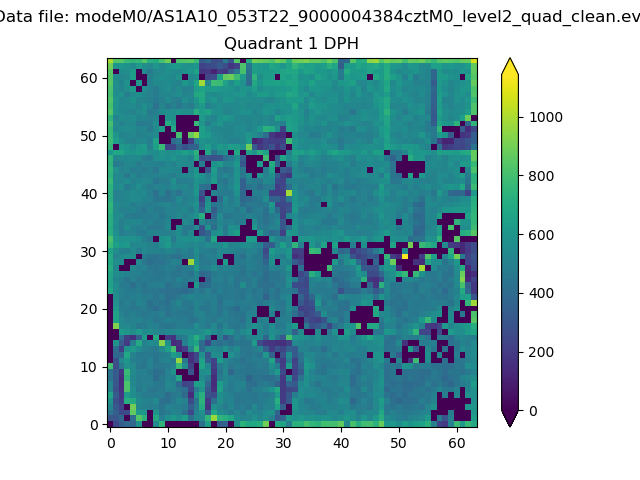 |
Quadrant B |
|---|---|---|---|
| Quadrant D |  |
 |
Quadrant C |
| Plot type | Count rate plots | Images |
|---|---|---|
| Comparison with Poisson distribution Blue bars denote a histogram of data divided into 1 sec bins. Red curve is a Poisson curve with rate = median count rate of data. |
 |
 |
| Quadrant-wise count rates Data is divided into 100 sec bins |
 |
|
| Module-wise count rates for Quadrant A Data is divided into 100 sec bins |
 |
 |
| Module-wise count rates for Quadrant B Data is divided into 100 sec bins |
 |
 |
| Module-wise count rates for Quadrant C Data is divided into 100 sec bins |
 |
 |
| Module-wise count rates for Quadrant D Data is divided into 100 sec bins |
 |
 |
| Parameter | Plot |
|---|---|
| CZT HV Monitor |  |
| D_VDD |  |
| Temperature 1 | 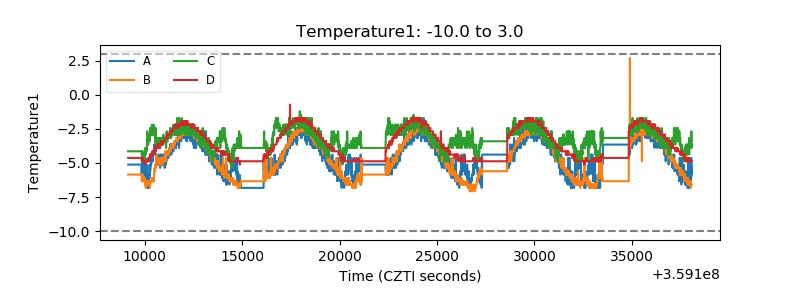 |
| Veto HV Monitor |  |
| Veto LLD |  |
| Alpha Counter |  |
| _CPM_Rate |  |
| CZT Counter | 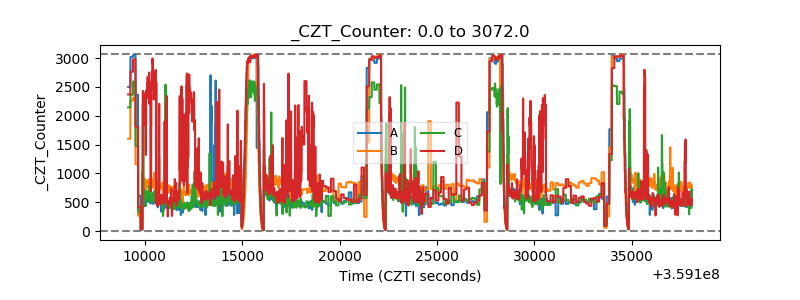 |
| +2.5 Volts monitor |  |
| +5 Volts monitor |  |
| _ROLL_ROT |  |
| _Roll_DEC | 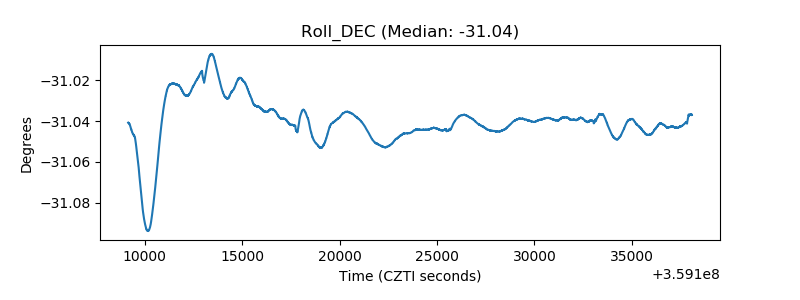 |
| _Roll_RA |  |
| Veto Counter | 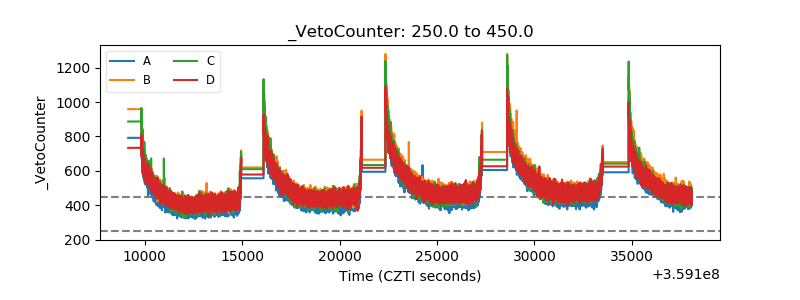 |