| Param | Original file | Final file |
|---|---|---|
| Filename | modeM0/AS1A10_058T04_9000004382cztM0_level2_bc.evt | modeM0/AS1A10_058T04_9000004382cztM0_level2_quad_clean.evt |
| Size (bytes) | 3,838,795,200 | 1,019,024,640 |
| Size | 3.6 GB | 971.8 MB |
| Events in quadrant A | 17,392,931 | 6,935,334 |
| Events in quadrant B | 38,916,784 | 6,856,873 |
| Events in quadrant C | 19,422,995 | 6,530,764 |
| Events in quadrant D | 35,413,902 | 5,388,292 |
| Mode SS | |||
|---|---|---|---|
| Quadrant | BADHDUFLAG | Total packets | Discarded packets |
| A | 0 | 1534 | 0 |
| B | 0 | 1534 | 0 |
| C | 0 | 1534 | 0 |
| D | 0 | 1534 | 0 |
| Mode M9 | |||
|---|---|---|---|
| Quadrant | BADHDUFLAG | Total packets | Discarded packets |
| A | 0 | 119 | 0 |
| B | 0 | 119 | 0 |
| C | 0 | 119 | 0 |
| D | 0 | 119 | 0 |
| Mode M0 | |||
|---|---|---|---|
| Quadrant | BADHDUFLAG | Total packets | Discarded packets |
| A | 0 | 160827 | 0 |
| B | 0 | 233889 | 0 |
| C | 0 | 170552 | 0 |
| D | 0 | 271937 | 0 |
| Quadrant | Total seconds | Saturated seconds | Saturation percentage |
|---|---|---|---|
| A | 75093 | 890 | 1.185197% |
| B | 75093 | 1997 | 2.659369% |
| C | 75093 | 1791 | 2.385043% |
| D | 75093 | 16229 | 21.611868% |
Noise dominated data is calculated using 1-second bins in cleaned event files. If a bin has >2000 counts, and if more than 50% of those come from <1% of pixels, then it is considered to be noise-dominated and hence unusable.
| Quadrant | # 1 sec bins | Bins with >0 counts | Bins with >2000 counts | High rate bins dominated by noise | Noise dominated (total time) | Noise dominated (detector-on time) | Marked lightcurve |
|---|---|---|---|---|---|---|---|
| A | 87179 | 75097 | 13 | 13 | 0.01% | 0.02% |  |
| B | 87179 | 75099 | 65 | 65 | 0.07% | 0.09% |  |
| C | 87179 | 75094 | 16 | 16 | 0.02% | 0.02% |  |
| D | 87179 | 74853 | 728 | 728 | 0.84% | 0.97% |  |
Top three noisy pixels from each quadrant. If the there are fewer than three noisy pixels in the level2.evt file, extra rows are filled as -1
| Pixel properties | Quadrant properties | ||||||
|---|---|---|---|---|---|---|---|
| Quadrant | DetID | PixID | Counts | Sigma | Mean | Median | Sigma |
| A | 0 | 13 | 729506 | 806.04 | 4211 | 4157 | 899.9 |
| A | 8 | 192 | 150974 | 163.15 | 4211 | 4157 | 899.9 |
| A | 13 | 254 | 137568 | 148.25 | 4211 | 4157 | 899.9 |
| B | 6 | 159 | 20424301 | 25483.18 | 4180 | 4083 | 801.3 |
| B | 0 | 229 | 1527980 | 1901.73 | 4180 | 4083 | 801.3 |
| B | 4 | 171 | 268896 | 330.47 | 4180 | 4083 | 801.3 |
| C | 3 | 233 | 3306213 | 3576.58 | 3945 | 3936 | 923.3 |
| C | 10 | 22 | 516666 | 555.32 | 3945 | 3936 | 923.3 |
| C | 0 | 10 | 250816 | 267.39 | 3945 | 3936 | 923.3 |
| D | 12 | 218 | 12134768 | 15275.55 | 3514 | 3418 | 794.2 |
| D | 13 | 104 | 3120845 | 3925.4 | 3514 | 3418 | 794.2 |
| D | 8 | 195 | 2751187 | 3459.94 | 3514 | 3418 | 794.2 |
Histogram calculated using DETX and DETY for each event in the final _common_clean file
| Quadrant A |  |
 |
Quadrant B |
|---|---|---|---|
| Quadrant D | 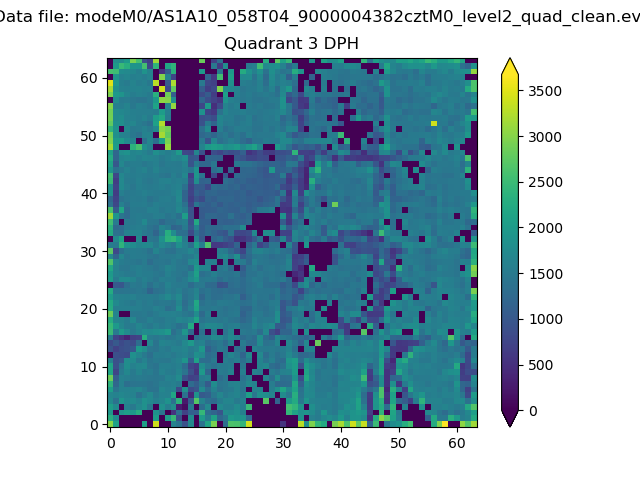 |
 |
Quadrant C |
| Plot type | Count rate plots | Images |
|---|---|---|
| Comparison with Poisson distribution Blue bars denote a histogram of data divided into 1 sec bins. Red curve is a Poisson curve with rate = median count rate of data. |
 |
 |
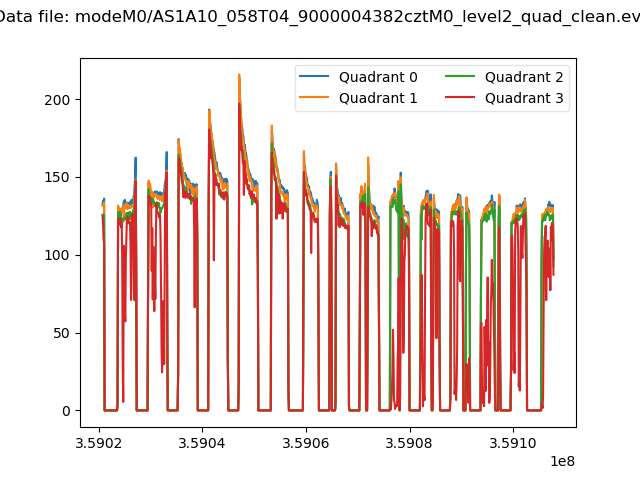
| Quadrant-wise count rates Data is divided into 100 sec bins |
 |
|
| Module-wise count rates for Quadrant A Data is divided into 100 sec bins |
 |
 |
| Module-wise count rates for Quadrant B Data is divided into 100 sec bins |
 |
 |
| Module-wise count rates for Quadrant C Data is divided into 100 sec bins |
 |
 |
| Module-wise count rates for Quadrant D Data is divided into 100 sec bins |
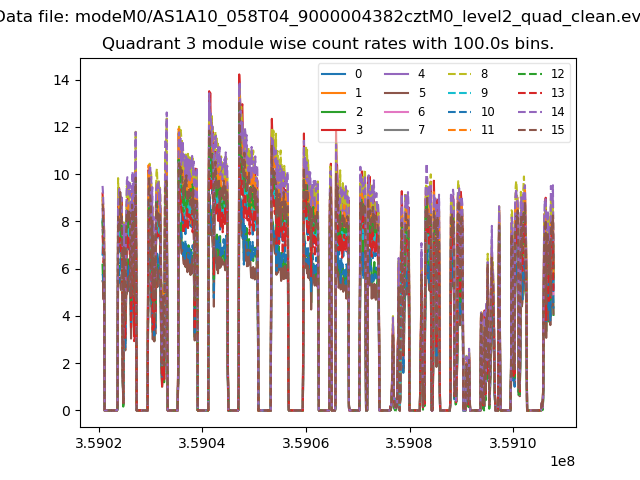 |
 |
| Parameter | Plot |
|---|---|
| CZT HV Monitor |  |
| D_VDD |  |
| Temperature 1 |  |
| Veto HV Monitor |  |
| Veto LLD |  |
| Alpha Counter |  |
| _CPM_Rate |  |
| CZT Counter |  |
| +2.5 Volts monitor | 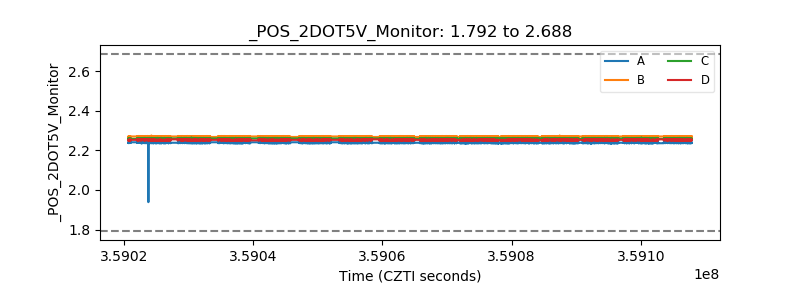 |
| +5 Volts monitor |  |
| _ROLL_ROT |  |
| _Roll_DEC |  |
| _Roll_RA | 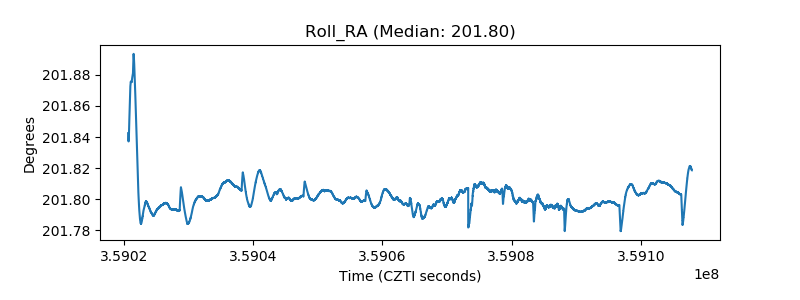 |
| Veto Counter |  |