| Param | Original file | Final file |
|---|---|---|
| Filename | modeM0/AS1A10_058T03_9000004380cztM0_level2_bc.evt | modeM0/AS1A10_058T03_9000004380cztM0_level2_quad_clean.evt |
| Size (bytes) | 3,511,644,480 | 978,710,400 |
| Size | 3.3 GB | 933.4 MB |
| Events in quadrant A | 15,910,246 | 6,450,336 |
| Events in quadrant B | 35,312,640 | 6,404,053 |
| Events in quadrant C | 23,328,203 | 6,021,659 |
| Events in quadrant D | 26,986,361 | 5,910,589 |
| Mode M9 | |||
|---|---|---|---|
| Quadrant | BADHDUFLAG | Total packets | Discarded packets |
| A | 0 | 101 | 0 |
| B | 0 | 101 | 0 |
| C | 0 | 101 | 0 |
| D | 0 | 101 | 0 |
| Mode M0 | |||
|---|---|---|---|
| Quadrant | BADHDUFLAG | Total packets | Discarded packets |
| A | 0 | 150416 | 0 |
| B | 0 | 216028 | 0 |
| C | 0 | 180416 | 0 |
| D | 0 | 188488 | 0 |
| Mode SS | |||
|---|---|---|---|
| Quadrant | BADHDUFLAG | Total packets | Discarded packets |
| A | 0 | 1442 | 0 |
| B | 0 | 1442 | 0 |
| C | 0 | 1442 | 0 |
| D | 0 | 1442 | 0 |
| Quadrant | Total seconds | Saturated seconds | Saturation percentage |
|---|---|---|---|
| A | 70849 | 751 | 1.060001% |
| B | 70849 | 1390 | 1.961919% |
| C | 70850 | 3493 | 4.930134% |
| D | 70850 | 2580 | 3.641496% |
Noise dominated data is calculated using 1-second bins in cleaned event files. If a bin has >2000 counts, and if more than 50% of those come from <1% of pixels, then it is considered to be noise-dominated and hence unusable.
| Quadrant | # 1 sec bins | Bins with >0 counts | Bins with >2000 counts | High rate bins dominated by noise | Noise dominated (total time) | Noise dominated (detector-on time) | Marked lightcurve |
|---|---|---|---|---|---|---|---|
| A | 86002 | 70851 | 6 | 6 | 0.01% | 0.01% |  |
| B | 86002 | 70852 | 32 | 32 | 0.04% | 0.05% |  |
| C | 86002 | 70851 | 94 | 94 | 0.11% | 0.13% |  |
| D | 86002 | 70852 | 73 | 73 | 0.08% | 0.10% |  |
Top three noisy pixels from each quadrant. If the there are fewer than three noisy pixels in the level2.evt file, extra rows are filled as -1
| Pixel properties | Quadrant properties | ||||||
|---|---|---|---|---|---|---|---|
| Quadrant | DetID | PixID | Counts | Sigma | Mean | Median | Sigma |
| A | 0 | 13 | 460339 | 539.48 | 3945 | 3891 | 846.1 |
| A | 8 | 192 | 131578 | 150.91 | 3945 | 3891 | 846.1 |
| A | 13 | 254 | 127443 | 146.03 | 3945 | 3891 | 846.1 |
| B | 6 | 159 | 19177568 | 25679.51 | 3929 | 3848 | 746.7 |
| B | 0 | 229 | 392482 | 520.5 | 3929 | 3848 | 746.7 |
| B | 4 | 171 | 266994 | 352.43 | 3929 | 3848 | 746.7 |
| C | 3 | 233 | 5177762 | 6067.76 | 3656 | 3650 | 852.7 |
| C | 15 | 208 | 2925482 | 3426.47 | 3656 | 3650 | 852.7 |
| C | 10 | 22 | 590094 | 687.73 | 3656 | 3650 | 852.7 |
| D | 13 | 104 | 6602046 | 7764.15 | 3782 | 3677 | 849.9 |
| D | 8 | 195 | 3469825 | 4078.54 | 3782 | 3677 | 849.9 |
| D | 2 | 250 | 695071 | 813.55 | 3782 | 3677 | 849.9 |
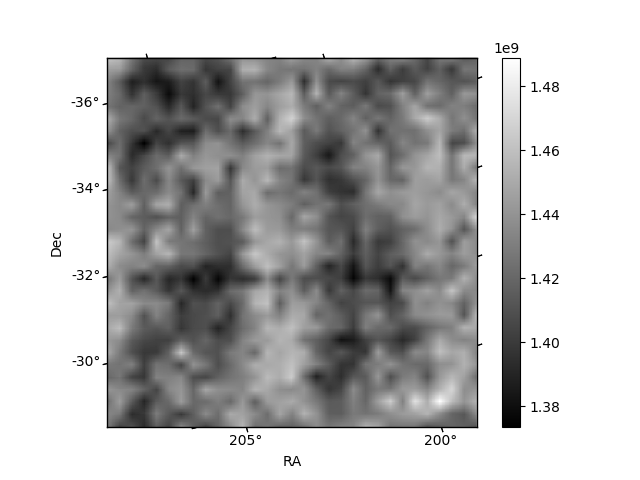
Histogram calculated using DETX and DETY for each event in the final _common_clean file
| Quadrant A | 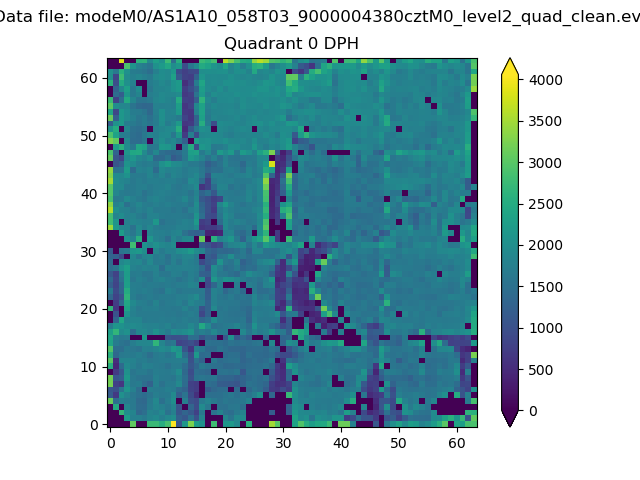 |
 |
Quadrant B |
|---|---|---|---|
| Quadrant D | 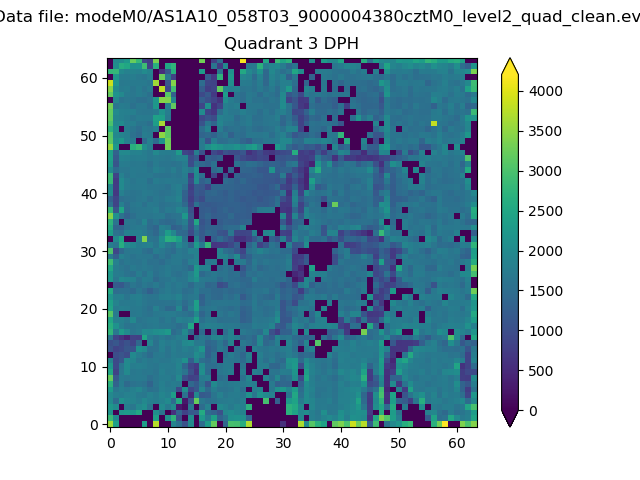 |
 |
Quadrant C |
| Plot type | Count rate plots | Images |
|---|---|---|
| Comparison with Poisson distribution Blue bars denote a histogram of data divided into 1 sec bins. Red curve is a Poisson curve with rate = median count rate of data. |
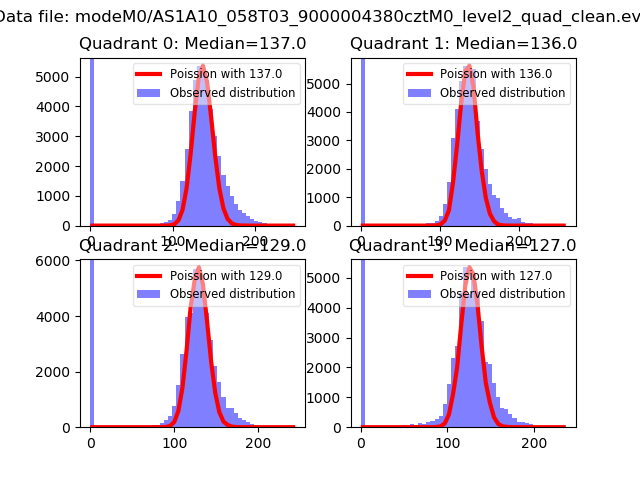 |
 |
| Quadrant-wise count rates Data is divided into 100 sec bins |
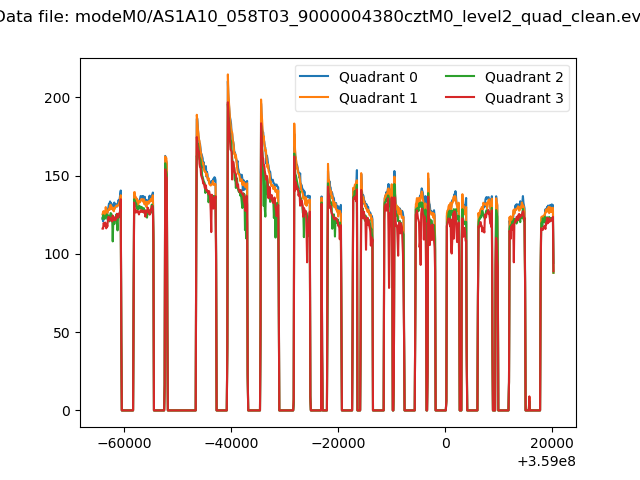 |
|
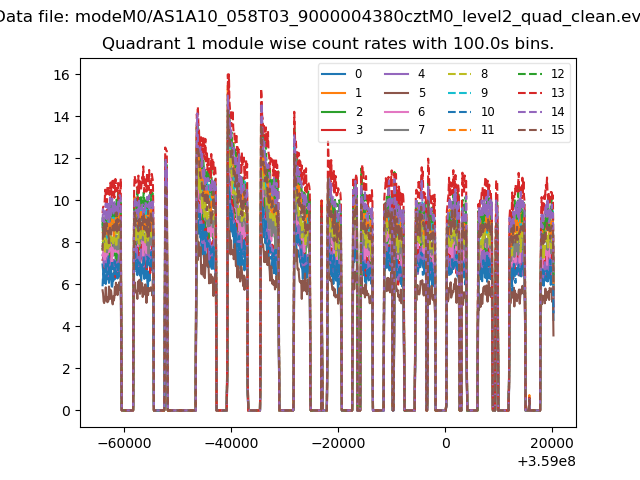
| Module-wise count rates for Quadrant A Data is divided into 100 sec bins |
 |
 |
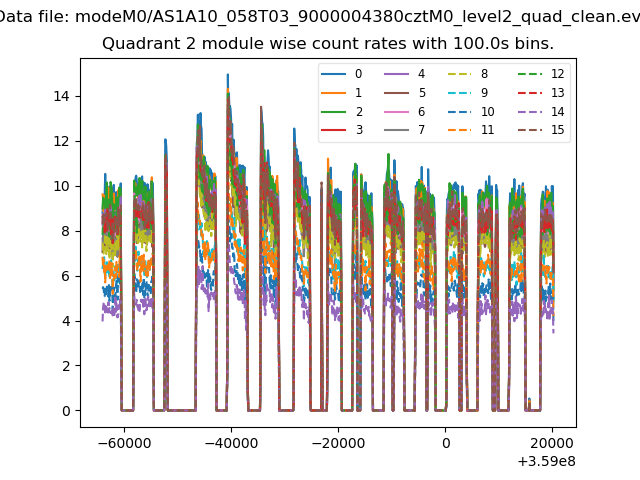
| Module-wise count rates for Quadrant B Data is divided into 100 sec bins |
 |
 |
| Module-wise count rates for Quadrant C Data is divided into 100 sec bins |
 |
 |
| Module-wise count rates for Quadrant D Data is divided into 100 sec bins |
 |
 |
| Parameter | Plot |
|---|---|
| CZT HV Monitor | 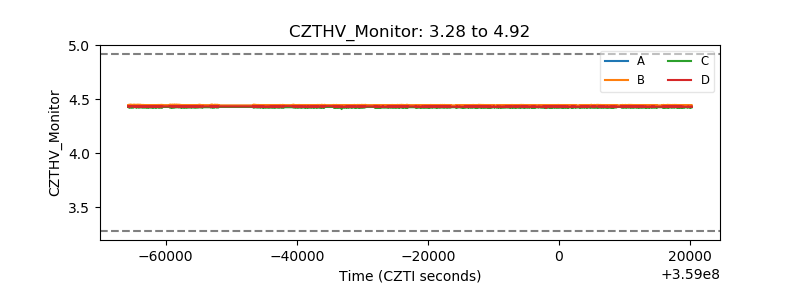 |
| D_VDD |  |
| Temperature 1 |  |
| Veto HV Monitor | 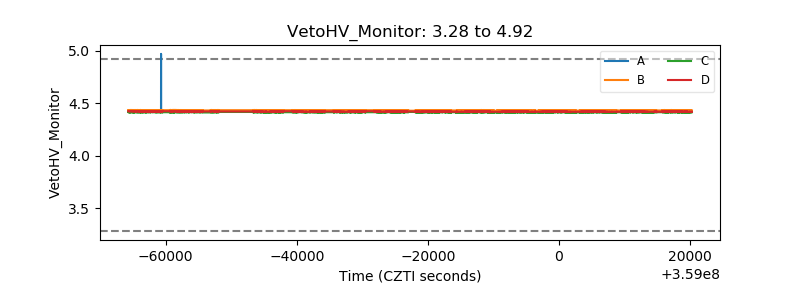 |
| Veto LLD |  |
| Alpha Counter | 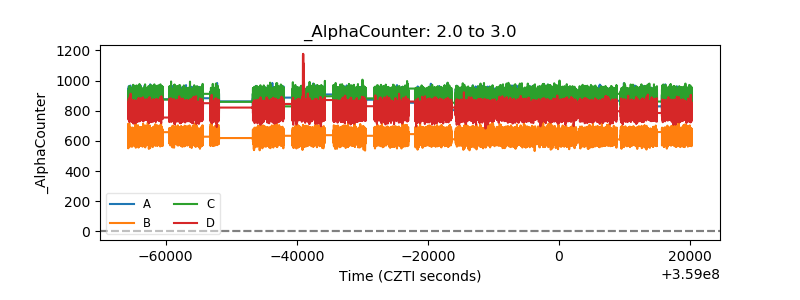 |
| _CPM_Rate |  |
| CZT Counter | 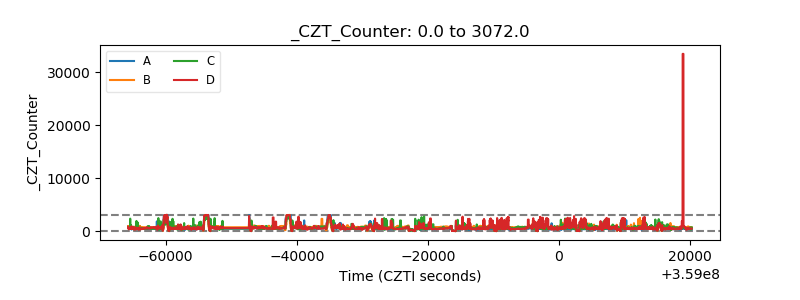 |
| +2.5 Volts monitor |  |
| +5 Volts monitor |  |
| _ROLL_ROT |  |
| _Roll_DEC | 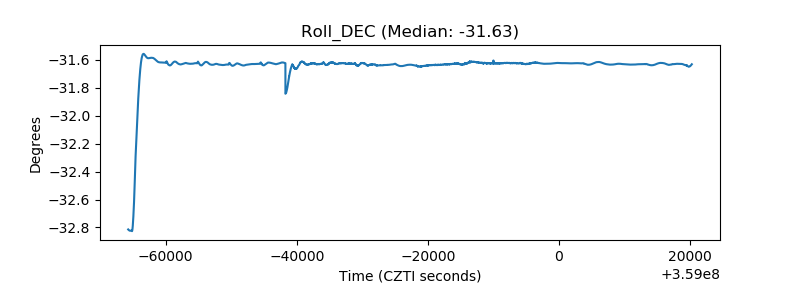 |
| _Roll_RA |  |
| Veto Counter |  |