| Param | Original file | Final file |
|---|---|---|
| Filename | modeM0/AS1A10_121T02_9000004378cztM0_level2_bc.evt | modeM0/AS1A10_121T02_9000004378cztM0_level2_quad_clean.evt |
| Size (bytes) | 11,092,239,360 | 2,818,152,000 |
| Size | 10.3 GB | 2.6 GB |
| Events in quadrant A | 56,272,393 | 18,501,183 |
| Events in quadrant B | 109,205,406 | 18,518,137 |
| Events in quadrant C | 64,472,094 | 18,188,973 |
| Events in quadrant D | 93,178,960 | 17,211,042 |
| Mode M0 | |||
|---|---|---|---|
| Quadrant | BADHDUFLAG | Total packets | Discarded packets |
| A | 0 | 408244 | 0 |
| B | 0 | 579793 | 0 |
| C | 0 | 439655 | 0 |
| D | 0 | 576531 | 0 |
| Mode SS | |||
|---|---|---|---|
| Quadrant | BADHDUFLAG | Total packets | Discarded packets |
| A | 0 | 3814 | 0 |
| B | 0 | 3814 | 0 |
| C | 0 | 3918 | 0 |
| D | 0 | 3814 | 0 |
| Mode M9 | |||
|---|---|---|---|
| Quadrant | BADHDUFLAG | Total packets | Discarded packets |
| A | 0 | 308 | 0 |
| B | 0 | 308 | 0 |
| C | 0 | 308 | 0 |
| D | 0 | 308 | 0 |
| Quadrant | Total seconds | Saturated seconds | Saturation percentage |
|---|---|---|---|
| A | 189542 | 2519 | 1.328993% |
| B | 188630 | 4251 | 2.253618% |
| C | 188657 | 6067 | 3.215889% |
| D | 189085 | 19220 | 10.164741% |
Noise dominated data is calculated using 1-second bins in cleaned event files. If a bin has >2000 counts, and if more than 50% of those come from <1% of pixels, then it is considered to be noise-dominated and hence unusable.
| Quadrant | # 1 sec bins | Bins with >0 counts | Bins with >2000 counts | High rate bins dominated by noise | Noise dominated (total time) | Noise dominated (detector-on time) | Marked lightcurve |
|---|---|---|---|---|---|---|---|
| A | 232107 | 191447 | 73 | 73 | 0.03% | 0.04% |  |
| B | 232107 | 188634 | 14 | 14 | 0.01% | 0.01% |  |
| C | 232107 | 189748 | 58 | 58 | 0.02% | 0.03% |  |
| D | 232107 | 190228 | 926 | 926 | 0.40% | 0.49% |  |
Top three noisy pixels from each quadrant. If the there are fewer than three noisy pixels in the level2.evt file, extra rows are filled as -1
| Pixel properties | Quadrant properties | ||||||
|---|---|---|---|---|---|---|---|
| Quadrant | DetID | PixID | Counts | Sigma | Mean | Median | Sigma |
| A | 0 | 13 | 1504794 | 559.87 | 13805 | 13682 | 2663.3 |
| A | 4 | 2 | 731725 | 269.6 | 13805 | 13682 | 2663.3 |
| A | 8 | 192 | 383267 | 138.77 | 13805 | 13682 | 2663.3 |
| B | 6 | 159 | 52546259 | 21909.55 | 13799 | 13584 | 2397.7 |
| B | 0 | 229 | 1954709 | 809.58 | 13799 | 13584 | 2397.7 |
| B | 0 | 230 | 236144 | 92.82 | 13799 | 13584 | 2397.7 |
| C | 3 | 233 | 9739619 | 3223.64 | 13205 | 13372 | 3017.2 |
| C | 14 | 238 | 1236883 | 405.52 | 13205 | 13372 | 3017.2 |
| C | 0 | 10 | 609721 | 197.65 | 13205 | 13372 | 3017.2 |
| D | 13 | 104 | 31258159 | 9959.31 | 12904 | 12713 | 3137.3 |
| D | 8 | 195 | 4033840 | 1281.71 | 12904 | 12713 | 3137.3 |
| D | 12 | 227 | 3196574 | 1014.84 | 12904 | 12713 | 3137.3 |
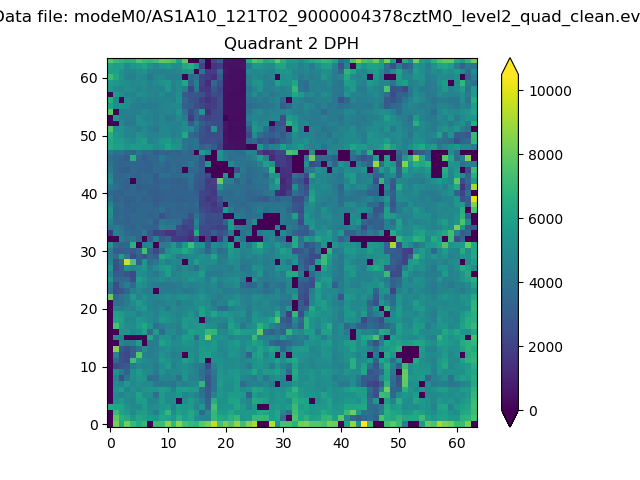
Histogram calculated using DETX and DETY for each event in the final _common_clean file
| Quadrant A |  |
 |
Quadrant B |
|---|---|---|---|
| Quadrant D |  |
 |
Quadrant C |
| Plot type | Count rate plots | Images |
|---|---|---|
| Comparison with Poisson distribution Blue bars denote a histogram of data divided into 1 sec bins. Red curve is a Poisson curve with rate = median count rate of data. |
 |
 |
| Quadrant-wise count rates Data is divided into 100 sec bins |
 |
|
| Module-wise count rates for Quadrant A Data is divided into 100 sec bins |
 |
 |
| Module-wise count rates for Quadrant B Data is divided into 100 sec bins |
 |
 |
| Module-wise count rates for Quadrant C Data is divided into 100 sec bins |
 |
 |
| Module-wise count rates for Quadrant D Data is divided into 100 sec bins |
 |
 |
| Parameter | Plot |
|---|---|
| CZT HV Monitor |  |
| D_VDD |  |
| Temperature 1 |  |
| Veto HV Monitor |  |
| Veto LLD |  |
| Alpha Counter |  |
| _CPM_Rate |  |
| CZT Counter |  |
| +2.5 Volts monitor |  |
| +5 Volts monitor |  |
| _ROLL_ROT |  |
| _Roll_DEC | 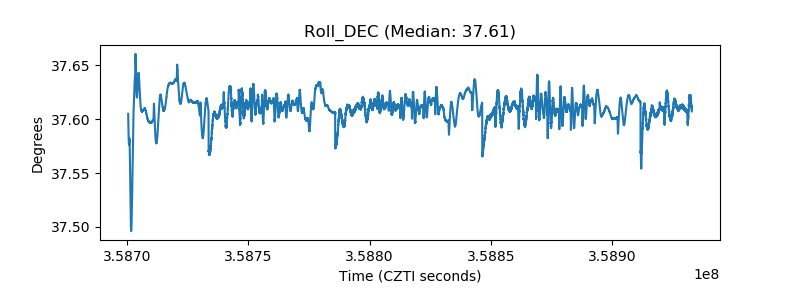 |
| _Roll_RA |  |
| Veto Counter |  |