| Param | Original file | Final file |
|---|---|---|
| Filename | modeM0/AS1C05_019T04_9000004376cztM0_level2_bc.evt | modeM0/AS1C05_019T04_9000004376cztM0_level2_quad_clean.evt |
| Size (bytes) | 4,474,563,840 | 1,553,880,960 |
| Size | 4.2 GB | 1.4 GB |
| Events in quadrant A | 24,832,982 | 10,288,549 |
| Events in quadrant B | 49,794,198 | 10,302,866 |
| Events in quadrant C | 22,161,249 | 10,125,005 |
| Events in quadrant D | 32,160,778 | 9,731,531 |
| Mode M9 | |||
|---|---|---|---|
| Quadrant | BADHDUFLAG | Total packets | Discarded packets |
| A | 0 | 157 | 0 |
| B | 0 | 157 | 0 |
| C | 0 | 157 | 0 |
| D | 0 | 157 | 0 |
| Mode SS | |||
|---|---|---|---|
| Quadrant | BADHDUFLAG | Total packets | Discarded packets |
| A | 0 | 1968 | 0 |
| B | 0 | 1968 | 0 |
| C | 0 | 1968 | 0 |
| D | 0 | 1968 | 0 |
| Mode M0 | |||
|---|---|---|---|
| Quadrant | BADHDUFLAG | Total packets | Discarded packets |
| A | 0 | 214063 | 0 |
| B | 0 | 297186 | 0 |
| C | 0 | 209200 | 0 |
| D | 0 | 244385 | 0 |
| Quadrant | Total seconds | Saturated seconds | Saturation percentage |
|---|---|---|---|
| A | 96598 | 1725 | 1.785751% |
| B | 96598 | 1988 | 2.058014% |
| C | 96598 | 2208 | 2.285762% |
| D | 96598 | 4096 | 4.240253% |
Noise dominated data is calculated using 1-second bins in cleaned event files. If a bin has >2000 counts, and if more than 50% of those come from <1% of pixels, then it is considered to be noise-dominated and hence unusable.
| Quadrant | # 1 sec bins | Bins with >0 counts | Bins with >2000 counts | High rate bins dominated by noise | Noise dominated (total time) | Noise dominated (detector-on time) | Marked lightcurve |
|---|---|---|---|---|---|---|---|
| A | 112188 | 96588 | 232 | 232 | 0.21% | 0.24% |  |
| B | 112188 | 96583 | 23 | 23 | 0.02% | 0.02% |  |
| C | 112188 | 96583 | 25 | 25 | 0.02% | 0.03% |  |
| D | 112188 | 96585 | 81 | 81 | 0.07% | 0.08% |  |
Top three noisy pixels from each quadrant. If the there are fewer than three noisy pixels in the level2.evt file, extra rows are filled as -1
| Pixel properties | Quadrant properties | ||||||
|---|---|---|---|---|---|---|---|
| Quadrant | DetID | PixID | Counts | Sigma | Mean | Median | Sigma |
| A | 14 | 239 | 2475332 | 2224.01 | 5179 | 5110 | 1110.7 |
| A | 0 | 13 | 2004901 | 1800.47 | 5179 | 5110 | 1110.7 |
| A | 8 | 192 | 212282 | 186.52 | 5179 | 5110 | 1110.7 |
| B | 6 | 159 | 26767495 | 27212.75 | 5214 | 5107 | 983.5 |
| B | 0 | 229 | 1898702 | 1925.46 | 5214 | 5107 | 983.5 |
| B | 4 | 80 | 549192 | 553.24 | 5214 | 5107 | 983.5 |
| C | 3 | 233 | 1579698 | 1313.46 | 5051 | 5044 | 1198.9 |
| C | 10 | 22 | 488422 | 403.2 | 5051 | 5044 | 1198.9 |
| C | 15 | 208 | 320605 | 263.22 | 5051 | 5044 | 1198.9 |
| D | 13 | 104 | 4343135 | 3422.92 | 5044 | 4922 | 1267.4 |
| D | 8 | 195 | 2842260 | 2238.71 | 5044 | 4922 | 1267.4 |
| D | 13 | 249 | 2767629 | 2179.82 | 5044 | 4922 | 1267.4 |
Histogram calculated using DETX and DETY for each event in the final _common_clean file
| Quadrant A |  |
 |
Quadrant B |
|---|---|---|---|
| Quadrant D |  |
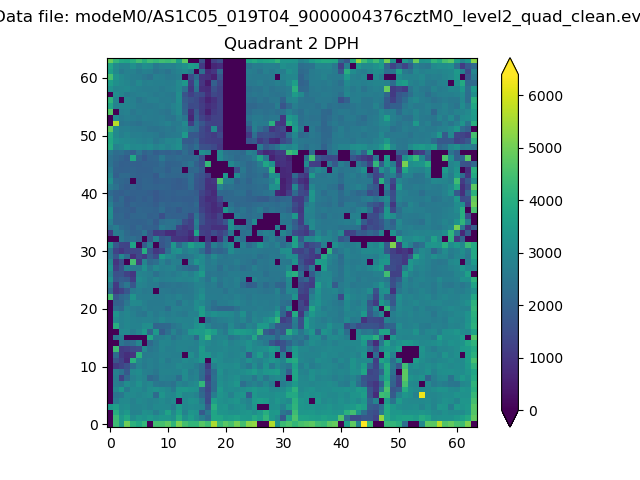 |
Quadrant C |
| Plot type | Count rate plots | Images |
|---|---|---|
| Comparison with Poisson distribution Blue bars denote a histogram of data divided into 1 sec bins. Red curve is a Poisson curve with rate = median count rate of data. |
 |
 |
| Quadrant-wise count rates Data is divided into 100 sec bins |
 |
|
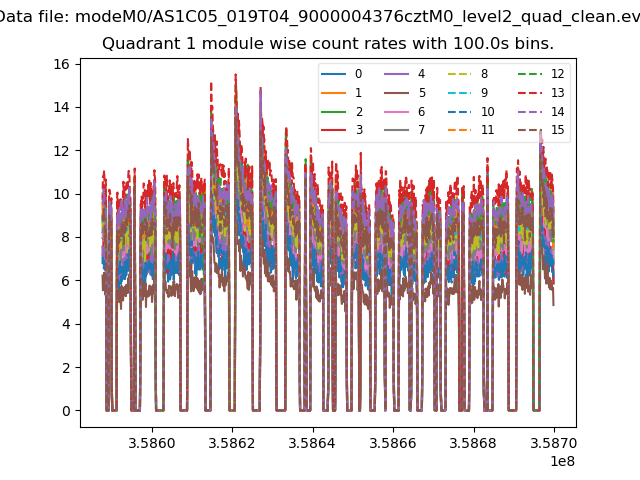
| Module-wise count rates for Quadrant A Data is divided into 100 sec bins |
 |
 |
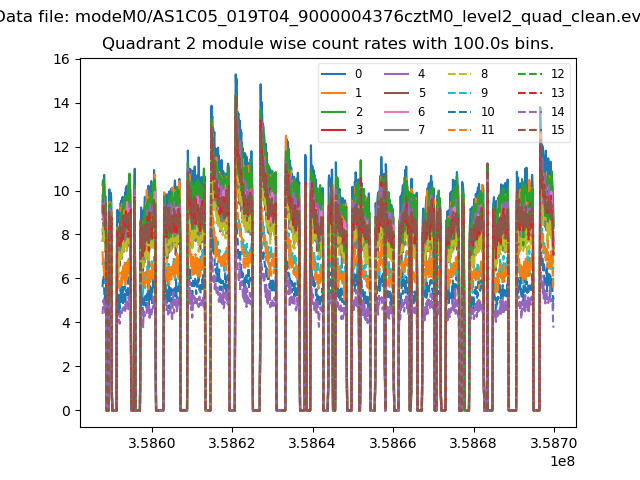
| Module-wise count rates for Quadrant B Data is divided into 100 sec bins |
 |
 |
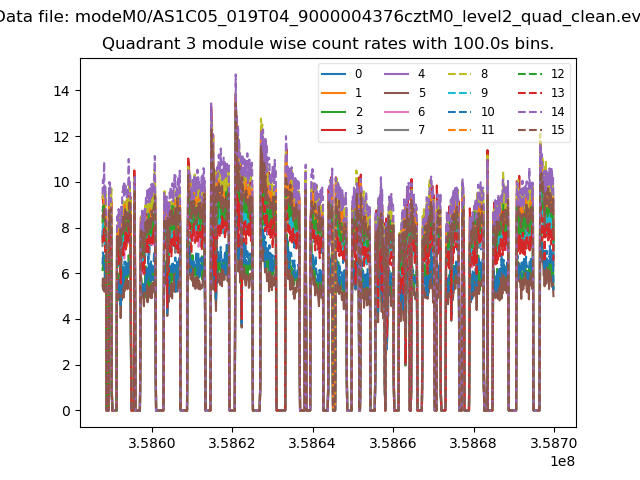
| Module-wise count rates for Quadrant C Data is divided into 100 sec bins |
 |
 |
| Module-wise count rates for Quadrant D Data is divided into 100 sec bins |
 |
 |
| Parameter | Plot |
|---|---|
| CZT HV Monitor |  |
| D_VDD | 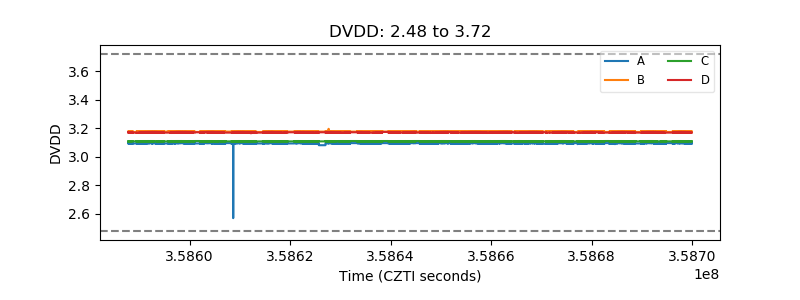 |
| Temperature 1 |  |
| Veto HV Monitor | 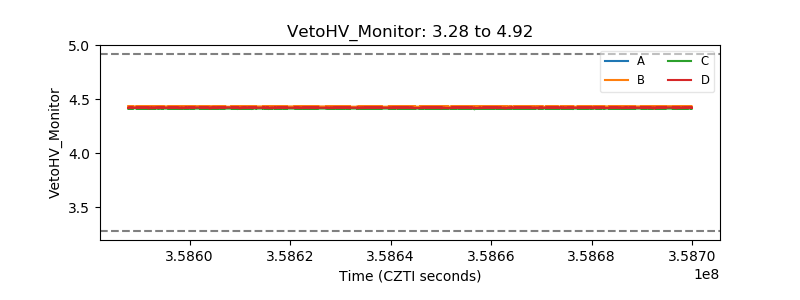 |
| Veto LLD |  |
| Alpha Counter |  |
| _CPM_Rate |  |
| CZT Counter |  |
| +2.5 Volts monitor | 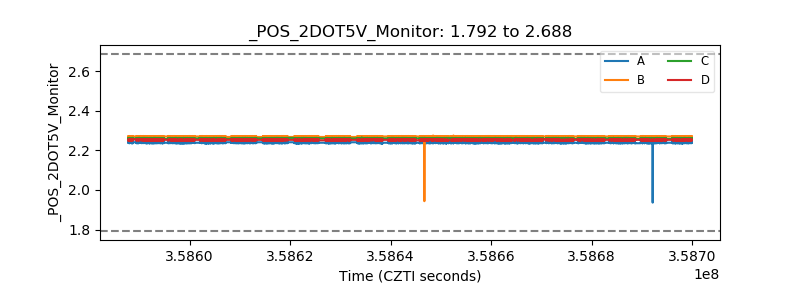 |
| +5 Volts monitor | 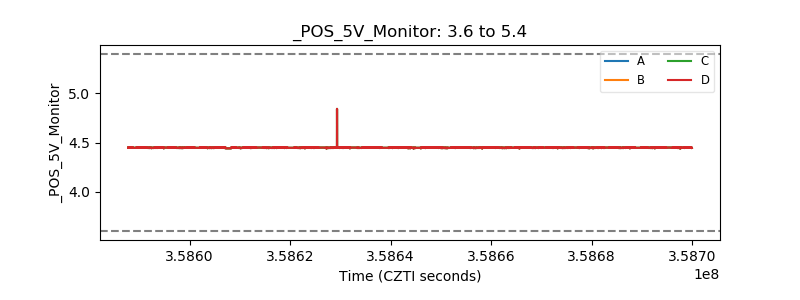 |
| _ROLL_ROT |  |
| _Roll_DEC |  |
| _Roll_RA |  |
| Veto Counter | 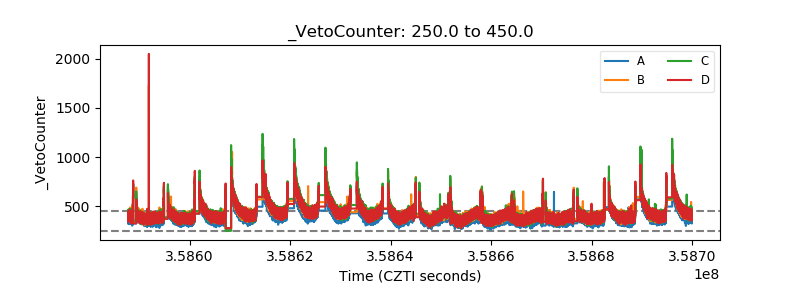 |