| Param | Original file | Final file |
|---|---|---|
| Filename | modeM0/AS1T04_002T01_9000004374cztM0_level2_bc.evt | modeM0/AS1T04_002T01_9000004374cztM0_level2_quad_clean.evt |
| Size (bytes) | 988,395,840 | 330,013,440 |
| Size | 942.6 MB | 314.7 MB |
| Events in quadrant A | 4,707,430 | 2,150,798 |
| Events in quadrant B | 11,859,079 | 2,145,773 |
| Events in quadrant C | 4,816,880 | 2,079,055 |
| Events in quadrant D | 6,956,048 | 2,014,181 |
| Mode M9 | |||
|---|---|---|---|
| Quadrant | BADHDUFLAG | Total packets | Discarded packets |
| A | 0 | 17 | 0 |
| B | 0 | 17 | 0 |
| C | 0 | 17 | 0 |
| D | 0 | 17 | 0 |
| Mode M0 | |||
|---|---|---|---|
| Quadrant | BADHDUFLAG | Total packets | Discarded packets |
| A | 0 | 47818 | 0 |
| B | 0 | 71800 | 0 |
| C | 0 | 50509 | 0 |
| D | 0 | 57318 | 0 |
| Mode SS | |||
|---|---|---|---|
| Quadrant | BADHDUFLAG | Total packets | Discarded packets |
| A | 0 | 476 | 0 |
| B | 0 | 476 | 0 |
| C | 0 | 476 | 0 |
| D | 0 | 476 | 0 |
| Quadrant | Total seconds | Saturated seconds | Saturation percentage |
|---|---|---|---|
| A | 23332 | 194 | 0.831476% |
| B | 23332 | 458 | 1.962969% |
| C | 23332 | 1563 | 6.698954% |
| D | 23332 | 940 | 4.028802% |
Noise dominated data is calculated using 1-second bins in cleaned event files. If a bin has >2000 counts, and if more than 50% of those come from <1% of pixels, then it is considered to be noise-dominated and hence unusable.
| Quadrant | # 1 sec bins | Bins with >0 counts | Bins with >2000 counts | High rate bins dominated by noise | Noise dominated (total time) | Noise dominated (detector-on time) | Marked lightcurve |
|---|---|---|---|---|---|---|---|
| A | 29365 | 23332 | 0 | 0 | 0.00% | 0.00% |  |
| B | 29364 | 23329 | 3 | 3 | 0.01% | 0.01% |  |
| C | 29364 | 23333 | 2 | 2 | 0.01% | 0.01% |  |
| D | 29364 | 23333 | 77 | 77 | 0.26% | 0.33% |  |
Top three noisy pixels from each quadrant. If the there are fewer than three noisy pixels in the level2.evt file, extra rows are filled as -1
| Pixel properties | Quadrant properties | ||||||
|---|---|---|---|---|---|---|---|
| Quadrant | DetID | PixID | Counts | Sigma | Mean | Median | Sigma |
| A | 8 | 192 | 56006 | 210.57 | 1188 | 1167 | 260.4 |
| A | 14 | 239 | 43582 | 162.86 | 1188 | 1167 | 260.4 |
| A | 13 | 254 | 42171 | 157.45 | 1188 | 1167 | 260.4 |
| B | 6 | 159 | 6397969 | 27820.49 | 1192 | 1165 | 229.9 |
| B | 0 | 229 | 829252 | 3601.45 | 1192 | 1165 | 229.9 |
| B | 4 | 187 | 26752 | 111.28 | 1192 | 1165 | 229.9 |
| C | 3 | 233 | 204488 | 759.22 | 1119 | 1114 | 267.9 |
| C | 14 | 254 | 157757 | 584.77 | 1119 | 1114 | 267.9 |
| C | 10 | 22 | 56082 | 205.2 | 1119 | 1114 | 267.9 |
| D | 13 | 249 | 880821 | 3010.14 | 1139 | 1107 | 292.3 |
| D | 13 | 104 | 493403 | 1684.5 | 1139 | 1107 | 292.3 |
| D | 8 | 195 | 420722 | 1435.8 | 1139 | 1107 | 292.3 |
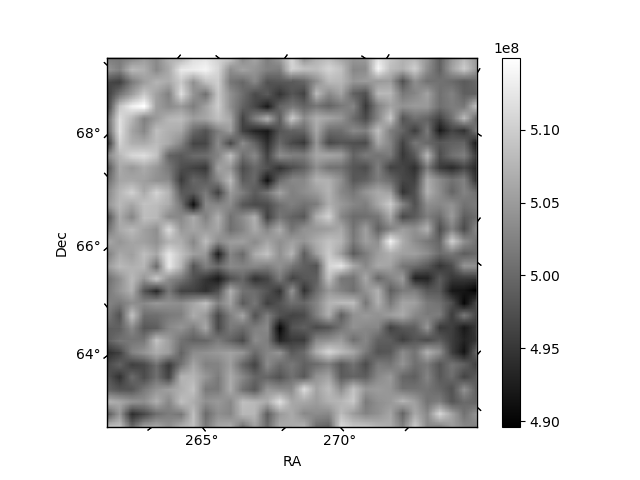
Histogram calculated using DETX and DETY for each event in the final _common_clean file
| Quadrant A |  |
 |
Quadrant B |
|---|---|---|---|
| Quadrant D |  |
 |
Quadrant C |
| Plot type | Count rate plots | Images |
|---|---|---|
| Comparison with Poisson distribution Blue bars denote a histogram of data divided into 1 sec bins. Red curve is a Poisson curve with rate = median count rate of data. |
 |
 |
| Quadrant-wise count rates Data is divided into 100 sec bins |
 |
|
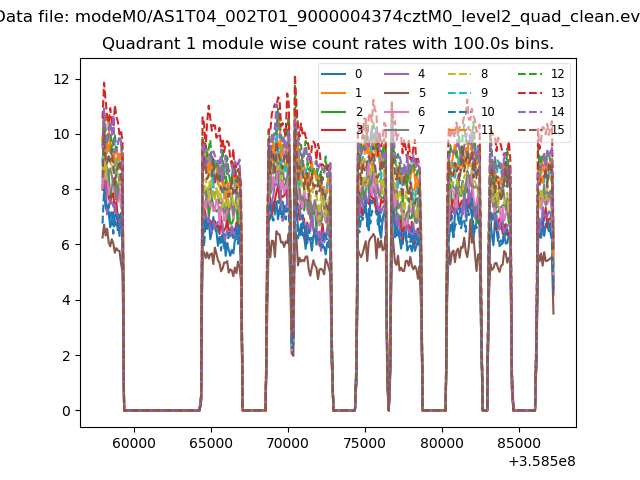
| Module-wise count rates for Quadrant A Data is divided into 100 sec bins |
 |
 |
| Module-wise count rates for Quadrant B Data is divided into 100 sec bins |
 |
 |
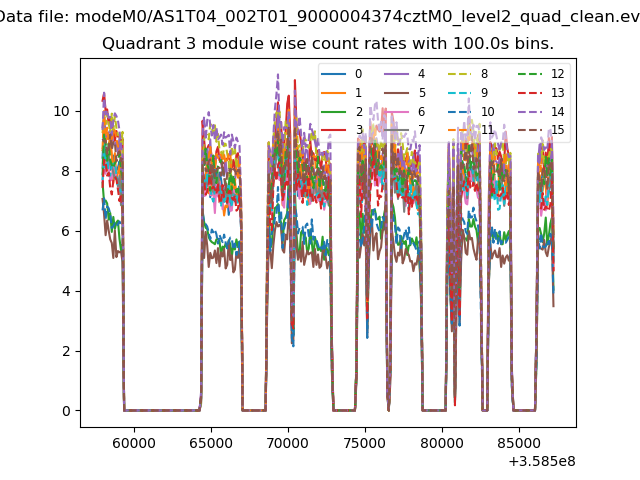
| Module-wise count rates for Quadrant C Data is divided into 100 sec bins |
 |
 |
| Module-wise count rates for Quadrant D Data is divided into 100 sec bins |
 |
 |
| Parameter | Plot |
|---|---|
| CZT HV Monitor |  |
| D_VDD |  |
| Temperature 1 |  |
| Veto HV Monitor |  |
| Veto LLD | 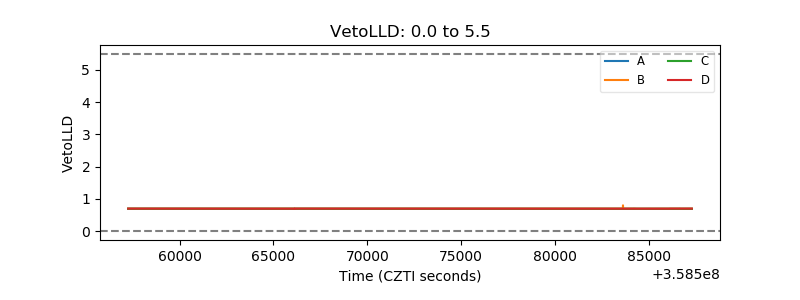 |
| Alpha Counter |  |
| _CPM_Rate |  |
| CZT Counter |  |
| +2.5 Volts monitor |  |
| +5 Volts monitor |  |
| _ROLL_ROT |  |
| _Roll_DEC |  |
| _Roll_RA | 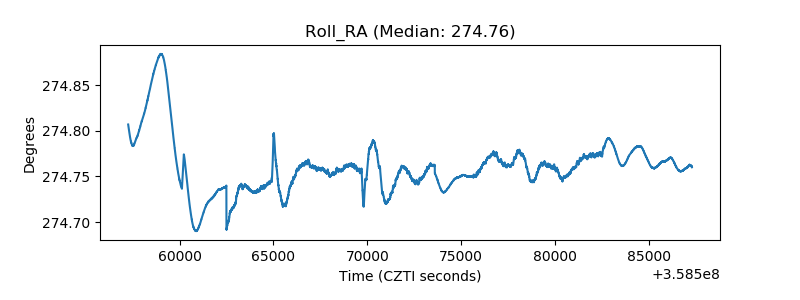 |
| Veto Counter |  |