| Param | Original file | Final file |
|---|---|---|
| Filename | modeM0/AS1A10_053T20_9000004372cztM0_level2_bc.evt | modeM0/AS1A10_053T20_9000004372cztM0_level2_quad_clean.evt |
| Size (bytes) | 728,127,360 | 234,083,520 |
| Size | 694.4 MB | 223.2 MB |
| Events in quadrant A | 3,814,011 | 1,543,655 |
| Events in quadrant B | 8,242,745 | 1,554,925 |
| Events in quadrant C | 3,552,288 | 1,475,146 |
| Events in quadrant D | 5,405,945 | 1,470,952 |
| Mode M0 | |||
|---|---|---|---|
| Quadrant | BADHDUFLAG | Total packets | Discarded packets |
| A | 0 | 33453 | 0 |
| B | 0 | 47423 | 0 |
| C | 0 | 33397 | 0 |
| D | 0 | 38627 | 0 |
| Mode M9 | |||
|---|---|---|---|
| Quadrant | BADHDUFLAG | Total packets | Discarded packets |
| A | 0 | 40 | 0 |
| B | 0 | 40 | 0 |
| C | 0 | 40 | 0 |
| D | 0 | 40 | 0 |
| Mode SS | |||
|---|---|---|---|
| Quadrant | BADHDUFLAG | Total packets | Discarded packets |
| A | 0 | 306 | 0 |
| B | 0 | 306 | 0 |
| C | 0 | 306 | 0 |
| D | 0 | 306 | 0 |
| Quadrant | Total seconds | Saturated seconds | Saturation percentage |
|---|---|---|---|
| A | 15162 | 241 | 1.589500% |
| B | 15162 | 443 | 2.921778% |
| C | 15162 | 500 | 3.297718% |
| D | 15162 | 444 | 2.928374% |
Noise dominated data is calculated using 1-second bins in cleaned event files. If a bin has >2000 counts, and if more than 50% of those come from <1% of pixels, then it is considered to be noise-dominated and hence unusable.
| Quadrant | # 1 sec bins | Bins with >0 counts | Bins with >2000 counts | High rate bins dominated by noise | Noise dominated (total time) | Noise dominated (detector-on time) | Marked lightcurve |
|---|---|---|---|---|---|---|---|
| A | 19032 | 15161 | 1 | 1 | 0.01% | 0.01% |  |
| B | 19032 | 15159 | 2 | 2 | 0.01% | 0.01% |  |
| C | 19032 | 15160 | 0 | 0 | 0.00% | 0.00% |  |
| D | 19032 | 15160 | 24 | 24 | 0.13% | 0.16% | 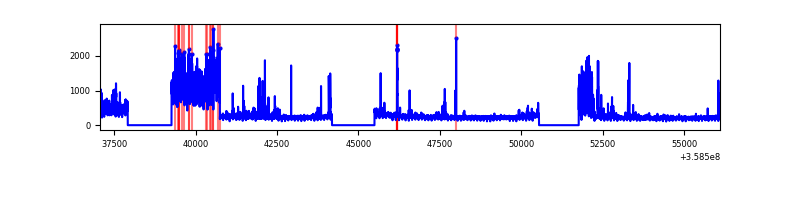 |
Top three noisy pixels from each quadrant. If the there are fewer than three noisy pixels in the level2.evt file, extra rows are filled as -1
| Pixel properties | Quadrant properties | ||||||
|---|---|---|---|---|---|---|---|
| Quadrant | DetID | PixID | Counts | Sigma | Mean | Median | Sigma |
| A | 0 | 13 | 202157 | 1027.71 | 918 | 905 | 195.8 |
| A | 8 | 192 | 35897 | 178.69 | 918 | 905 | 195.8 |
| A | 13 | 254 | 27775 | 137.21 | 918 | 905 | 195.8 |
| B | 6 | 159 | 4335407 | 25162.13 | 923 | 906 | 172.3 |
| B | 0 | 229 | 303302 | 1755.43 | 923 | 906 | 172.3 |
| B | 5 | 172 | 61951 | 354.37 | 923 | 906 | 172.3 |
| C | 10 | 22 | 74212 | 360.82 | 871 | 874 | 203.3 |
| C | 3 | 233 | 51790 | 250.5 | 871 | 874 | 203.3 |
| C | 14 | 254 | 49906 | 241.23 | 871 | 874 | 203.3 |
| D | 8 | 195 | 1466804 | 7442.48 | 886 | 861 | 197.0 |
| D | 13 | 104 | 344327 | 1743.75 | 886 | 861 | 197.0 |
| D | 13 | 249 | 97976 | 493.05 | 886 | 861 | 197.0 |
Histogram calculated using DETX and DETY for each event in the final _common_clean file
| Quadrant A |  |
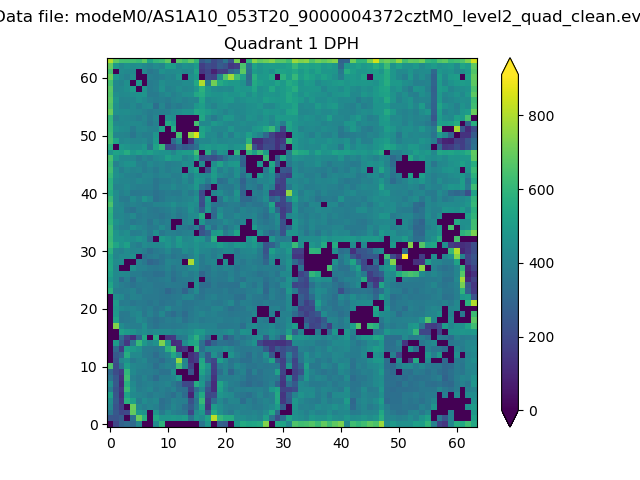 |
Quadrant B |
|---|---|---|---|
| Quadrant D |  |
 |
Quadrant C |
| Plot type | Count rate plots | Images |
|---|---|---|
| Comparison with Poisson distribution Blue bars denote a histogram of data divided into 1 sec bins. Red curve is a Poisson curve with rate = median count rate of data. |
 |
 |
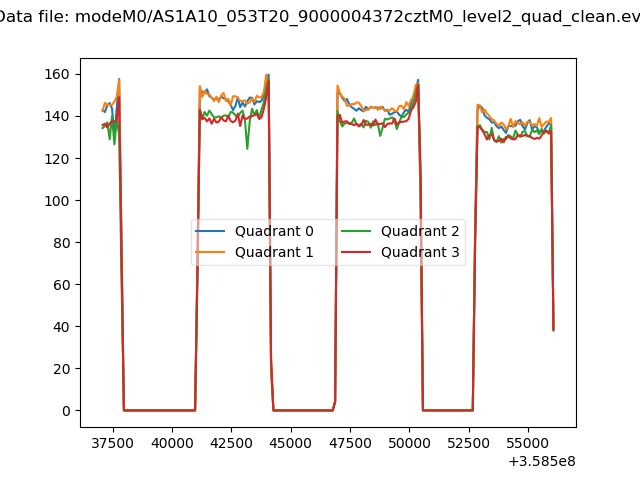
| Quadrant-wise count rates Data is divided into 100 sec bins |
 |
|
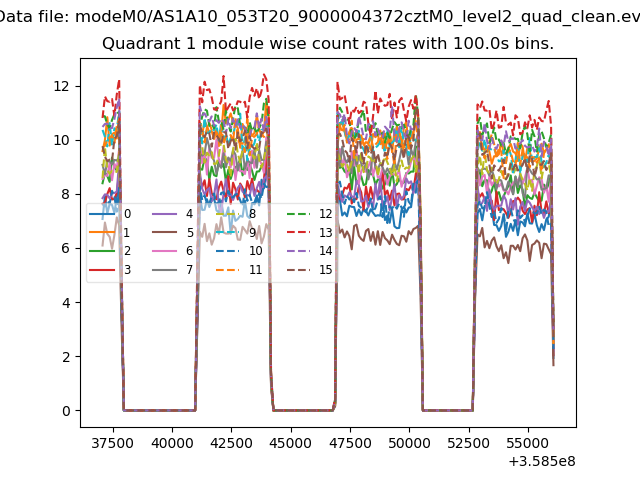
| Module-wise count rates for Quadrant A Data is divided into 100 sec bins |
 |
 |
| Module-wise count rates for Quadrant B Data is divided into 100 sec bins |
 |
 |
| Module-wise count rates for Quadrant C Data is divided into 100 sec bins |
 |
 |
| Module-wise count rates for Quadrant D Data is divided into 100 sec bins |
 |
 |
| Parameter | Plot |
|---|---|
| CZT HV Monitor |  |
| D_VDD |  |
| Temperature 1 |  |
| Veto HV Monitor |  |
| Veto LLD |  |
| Alpha Counter |  |
| _CPM_Rate | 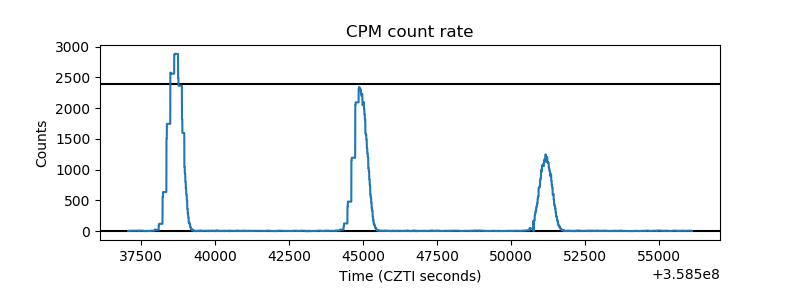 |
| CZT Counter | 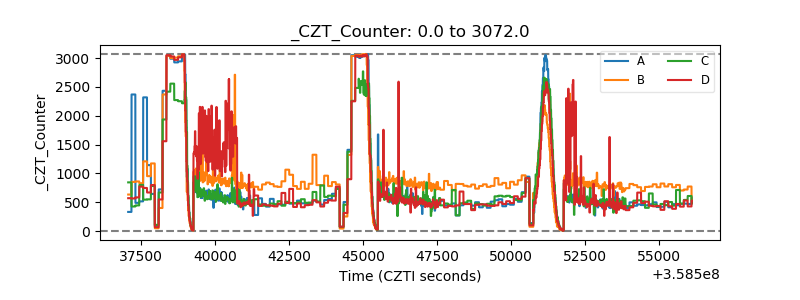 |
| +2.5 Volts monitor |  |
| +5 Volts monitor |  |
| _ROLL_ROT |  |
| _Roll_DEC |  |
| _Roll_RA |  |
| Veto Counter | 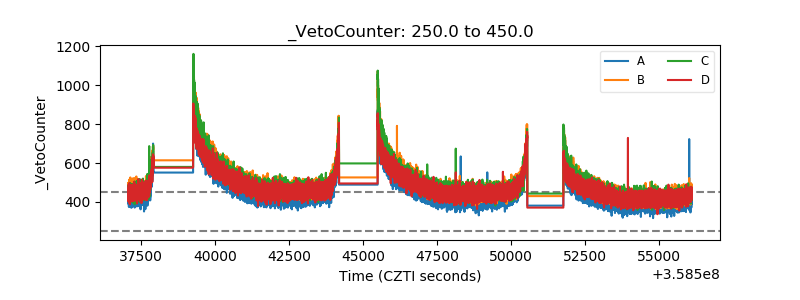 |