| Param | Original file | Final file |
|---|---|---|
| Filename | modeM0/AS1T04_006T01_9000004370cztM0_level2_bc.evt | modeM0/AS1T04_006T01_9000004370cztM0_level2_quad_clean.evt |
| Size (bytes) | 4,121,418,240 | 1,300,849,920 |
| Size | 3.8 GB | 1.2 GB |
| Events in quadrant A | 22,411,187 | 8,435,668 |
| Events in quadrant B | 46,381,466 | 8,525,693 |
| Events in quadrant C | 20,221,377 | 8,240,969 |
| Events in quadrant D | 29,682,718 | 8,027,365 |
| Mode M9 | |||
|---|---|---|---|
| Quadrant | BADHDUFLAG | Total packets | Discarded packets |
| A | 0 | 153 | 0 |
| B | 0 | 152 | 0 |
| C | 0 | 153 | 0 |
| D | 0 | 153 | 0 |
| Mode M0 | |||
|---|---|---|---|
| Quadrant | BADHDUFLAG | Total packets | Discarded packets |
| A | 0 | 198603 | 0 |
| B | 0 | 278589 | 0 |
| C | 0 | 192093 | 0 |
| D | 0 | 221662 | 0 |
| Mode SS | |||
|---|---|---|---|
| Quadrant | BADHDUFLAG | Total packets | Discarded packets |
| A | 0 | 1838 | 0 |
| B | 0 | 1838 | 0 |
| C | 0 | 1838 | 0 |
| D | 0 | 1840 | 0 |
| Quadrant | Total seconds | Saturated seconds | Saturation percentage |
|---|---|---|---|
| A | 90066 | 1875 | 2.081807% |
| B | 90039 | 2291 | 2.544453% |
| C | 90065 | 1854 | 2.058513% |
| D | 90047 | 2632 | 2.922918% |
Noise dominated data is calculated using 1-second bins in cleaned event files. If a bin has >2000 counts, and if more than 50% of those come from <1% of pixels, then it is considered to be noise-dominated and hence unusable.
| Quadrant | # 1 sec bins | Bins with >0 counts | Bins with >2000 counts | High rate bins dominated by noise | Noise dominated (total time) | Noise dominated (detector-on time) | Marked lightcurve |
|---|---|---|---|---|---|---|---|
| A | 105539 | 90115 | 163 | 163 | 0.15% | 0.18% |  |
| B | 105539 | 90097 | 6 | 6 | 0.01% | 0.01% |  |
| C | 105539 | 90117 | 2 | 2 | 0.00% | 0.00% |  |
| D | 105539 | 90102 | 171 | 171 | 0.16% | 0.19% |  |
Top three noisy pixels from each quadrant. If the there are fewer than three noisy pixels in the level2.evt file, extra rows are filled as -1
| Pixel properties | Quadrant properties | ||||||
|---|---|---|---|---|---|---|---|
| Quadrant | DetID | PixID | Counts | Sigma | Mean | Median | Sigma |
| A | 14 | 239 | 1472847 | 1336.53 | 5114 | 5049 | 1098.2 |
| A | 0 | 13 | 773750 | 699.95 | 5114 | 5049 | 1098.2 |
| A | 8 | 192 | 196448 | 174.28 | 5114 | 5049 | 1098.2 |
| B | 6 | 159 | 24943012 | 25667.81 | 5132 | 5029 | 971.6 |
| B | 0 | 229 | 800511 | 818.76 | 5132 | 5029 | 971.6 |
| B | 0 | 190 | 245981 | 248.0 | 5132 | 5029 | 971.6 |
| C | 3 | 233 | 1062262 | 908.82 | 4909 | 4905 | 1163.4 |
| C | 2 | 114 | 173704 | 145.09 | 4909 | 4905 | 1163.4 |
| C | 0 | 10 | 56300 | 44.17 | 4909 | 4905 | 1163.4 |
| D | 13 | 104 | 3500748 | 2782.16 | 4944 | 4835 | 1256.5 |
| D | 8 | 195 | 3430437 | 2726.21 | 4944 | 4835 | 1256.5 |
| D | 2 | 250 | 836594 | 661.94 | 4944 | 4835 | 1256.5 |
Histogram calculated using DETX and DETY for each event in the final _common_clean file
| Quadrant A |  |
 |
Quadrant B |
|---|---|---|---|
| Quadrant D |  |
 |
Quadrant C |
| Plot type | Count rate plots | Images |
|---|---|---|
| Comparison with Poisson distribution Blue bars denote a histogram of data divided into 1 sec bins. Red curve is a Poisson curve with rate = median count rate of data. |
 |
 |
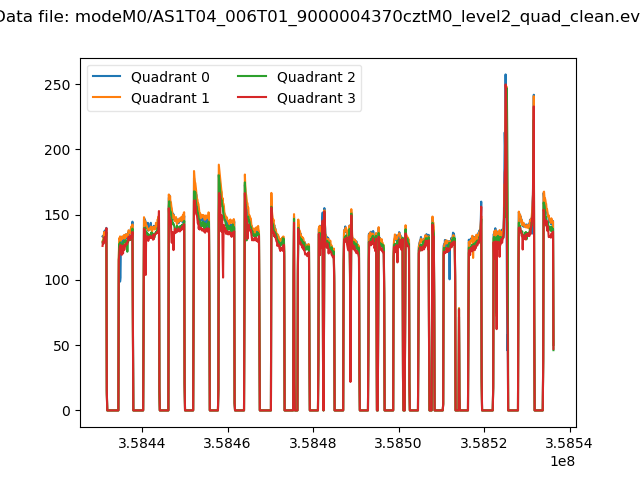
| Quadrant-wise count rates Data is divided into 100 sec bins |
 |
|
| Module-wise count rates for Quadrant A Data is divided into 100 sec bins |
 |
 |
| Module-wise count rates for Quadrant B Data is divided into 100 sec bins |
 |
 |
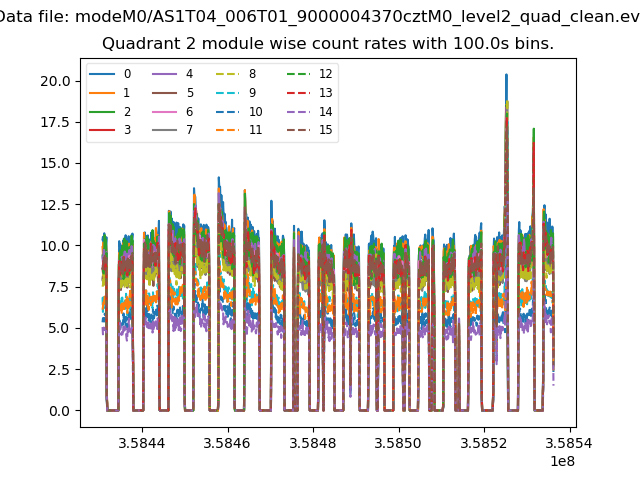
| Module-wise count rates for Quadrant C Data is divided into 100 sec bins |
 |
 |
| Module-wise count rates for Quadrant D Data is divided into 100 sec bins |
 |
 |
| Parameter | Plot |
|---|---|
| CZT HV Monitor |  |
| D_VDD |  |
| Temperature 1 |  |
| Veto HV Monitor |  |
| Veto LLD | 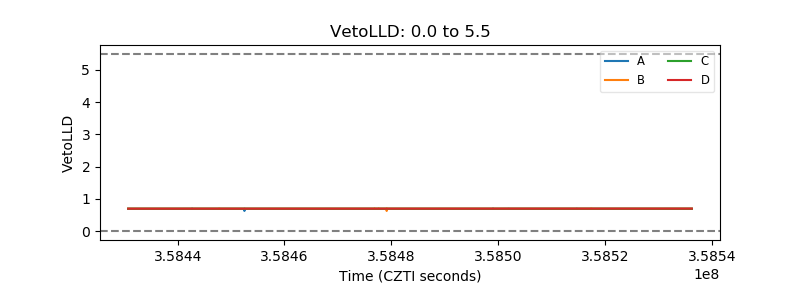 |
| Alpha Counter |  |
| _CPM_Rate |  |
| CZT Counter |  |
| +2.5 Volts monitor |  |
| +5 Volts monitor |  |
| _ROLL_ROT | 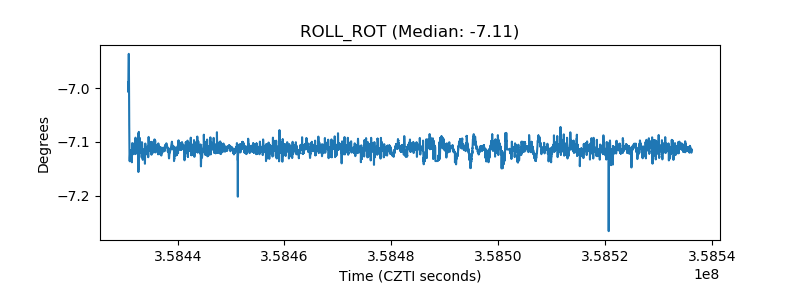 |
| _Roll_DEC |  |
| _Roll_RA |  |
| Veto Counter |  |