| Param | Original file | Final file |
|---|---|---|
| Filename | modeM0/AS1A10_053T15_9000004364cztM0_level2_bc.evt | modeM0/AS1A10_053T15_9000004364cztM0_level2_quad_clean.evt |
| Size (bytes) | 3,534,773,760 | 842,201,280 |
| Size | 3.3 GB | 803.2 MB |
| Events in quadrant A | 13,971,694 | 5,486,262 |
| Events in quadrant B | 30,528,259 | 5,500,074 |
| Events in quadrant C | 39,343,504 | 5,044,327 |
| Events in quadrant D | 19,028,769 | 5,254,970 |
| Mode M0 | |||
|---|---|---|---|
| Quadrant | BADHDUFLAG | Total packets | Discarded packets |
| A | 0 | 130443 | 0 |
| B | 0 | 186820 | 0 |
| C | 0 | 218360 | 0 |
| D | 0 | 145805 | 0 |
| Mode M9 | |||
|---|---|---|---|
| Quadrant | BADHDUFLAG | Total packets | Discarded packets |
| A | 0 | 101 | 0 |
| B | 0 | 101 | 0 |
| C | 0 | 101 | 0 |
| D | 0 | 101 | 0 |
| Mode SS | |||
|---|---|---|---|
| Quadrant | BADHDUFLAG | Total packets | Discarded packets |
| A | 0 | 1252 | 0 |
| B | 0 | 1252 | 0 |
| C | 0 | 1252 | 0 |
| D | 0 | 1252 | 0 |
| Quadrant | Total seconds | Saturated seconds | Saturation percentage |
|---|---|---|---|
| A | 61571 | 742 | 1.205113% |
| B | 61571 | 1319 | 2.142242% |
| C | 61571 | 8322 | 13.516103% |
| D | 61571 | 982 | 1.594907% |
Noise dominated data is calculated using 1-second bins in cleaned event files. If a bin has >2000 counts, and if more than 50% of those come from <1% of pixels, then it is considered to be noise-dominated and hence unusable.
| Quadrant | # 1 sec bins | Bins with >0 counts | Bins with >2000 counts | High rate bins dominated by noise | Noise dominated (total time) | Noise dominated (detector-on time) | Marked lightcurve |
|---|---|---|---|---|---|---|---|
| A | 71621 | 61564 | 6 | 6 | 0.01% | 0.01% |  |
| B | 71621 | 61562 | 1 | 1 | 0.00% | 0.00% |  |
| C | 71620 | 61561 | 1023 | 1023 | 1.43% | 1.66% |  |
| D | 71621 | 61565 | 34 | 34 | 0.05% | 0.06% |  |
Top three noisy pixels from each quadrant. If the there are fewer than three noisy pixels in the level2.evt file, extra rows are filled as -1
| Pixel properties | Quadrant properties | ||||||
|---|---|---|---|---|---|---|---|
| Quadrant | DetID | PixID | Counts | Sigma | Mean | Median | Sigma |
| A | 14 | 239 | 154539 | 204.0 | 3513 | 3464 | 740.6 |
| A | 8 | 192 | 121003 | 158.72 | 3513 | 3464 | 740.6 |
| A | 13 | 254 | 112857 | 147.72 | 3513 | 3464 | 740.6 |
| B | 6 | 159 | 16845909 | 25776.52 | 3527 | 3456 | 653.4 |
| B | 0 | 190 | 66336 | 96.23 | 3527 | 3456 | 653.4 |
| B | 4 | 187 | 42062 | 59.08 | 3527 | 3456 | 653.4 |
| C | 3 | 233 | 26633301 | 35340.45 | 3223 | 3222 | 753.5 |
| C | 2 | 114 | 112149 | 144.56 | 3223 | 3222 | 753.5 |
| C | 14 | 254 | 76885 | 97.76 | 3223 | 3222 | 753.5 |
| D | 1 | 52 | 2064600 | 2602.01 | 3410 | 3328 | 792.2 |
| D | 8 | 195 | 1303296 | 1640.99 | 3410 | 3328 | 792.2 |
| D | 2 | 250 | 985766 | 1240.16 | 3410 | 3328 | 792.2 |
Histogram calculated using DETX and DETY for each event in the final _common_clean file
| Quadrant A |  |
 |
Quadrant B |
|---|---|---|---|
| Quadrant D |  |
 |
Quadrant C |
| Plot type | Count rate plots | Images |
|---|---|---|
| Comparison with Poisson distribution Blue bars denote a histogram of data divided into 1 sec bins. Red curve is a Poisson curve with rate = median count rate of data. |
 |
 |
| Quadrant-wise count rates Data is divided into 100 sec bins |
 |
|
| Module-wise count rates for Quadrant A Data is divided into 100 sec bins |
 |
 |
| Module-wise count rates for Quadrant B Data is divided into 100 sec bins |
 |
 |
| Module-wise count rates for Quadrant C Data is divided into 100 sec bins |
 |
 |
| Module-wise count rates for Quadrant D Data is divided into 100 sec bins |
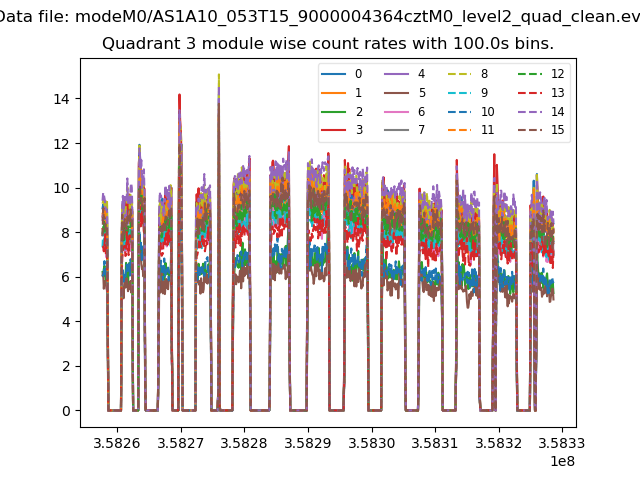 |
 |
| Parameter | Plot |
|---|---|
| CZT HV Monitor |  |
| D_VDD |  |
| Temperature 1 |  |
| Veto HV Monitor | 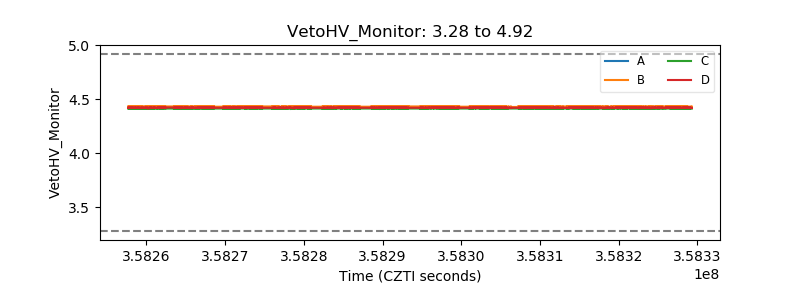 |
| Veto LLD |  |
| Alpha Counter | 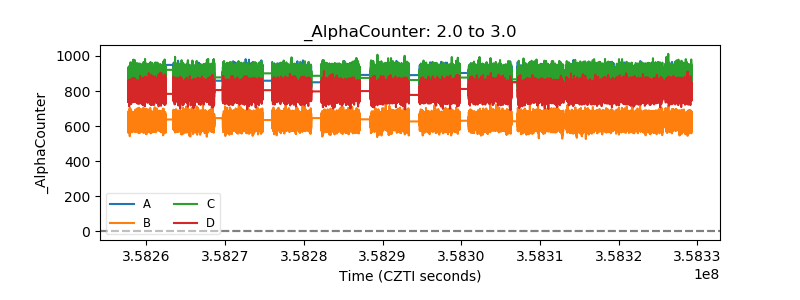 |
| _CPM_Rate |  |
| CZT Counter |  |
| +2.5 Volts monitor |  |
| +5 Volts monitor |  |
| _ROLL_ROT |  |
| _Roll_DEC |  |
| _Roll_RA |  |
| Veto Counter |  |