| Param | Original file | Final file |
|---|---|---|
| Filename | modeM0/AS1A10_053T14_9000004362cztM0_level2_bc.evt | modeM0/AS1A10_053T14_9000004362cztM0_level2_quad_clean.evt |
| Size (bytes) | 2,324,050,560 | 750,087,360 |
| Size | 2.2 GB | 715.3 MB |
| Events in quadrant A | 11,940,538 | 4,859,128 |
| Events in quadrant B | 25,938,191 | 4,871,119 |
| Events in quadrant C | 12,157,374 | 4,724,765 |
| Events in quadrant D | 16,769,059 | 4,657,800 |
| Mode SS | |||
|---|---|---|---|
| Quadrant | BADHDUFLAG | Total packets | Discarded packets |
| A | 0 | 1070 | 0 |
| B | 0 | 1070 | 0 |
| C | 0 | 1070 | 0 |
| D | 0 | 1070 | 0 |
| Mode M9 | |||
|---|---|---|---|
| Quadrant | BADHDUFLAG | Total packets | Discarded packets |
| A | 0 | 75 | 0 |
| B | 0 | 75 | 0 |
| C | 0 | 75 | 0 |
| D | 0 | 75 | 0 |
| Mode M0 | |||
|---|---|---|---|
| Quadrant | BADHDUFLAG | Total packets | Discarded packets |
| A | 0 | 112389 | 0 |
| B | 0 | 159719 | 0 |
| C | 0 | 114844 | 0 |
| D | 0 | 129634 | 0 |
| Quadrant | Total seconds | Saturated seconds | Saturation percentage |
|---|---|---|---|
| A | 52571 | 705 | 1.341044% |
| B | 52571 | 1412 | 2.685891% |
| C | 52571 | 1464 | 2.784805% |
| D | 52571 | 2892 | 5.501132% |
Noise dominated data is calculated using 1-second bins in cleaned event files. If a bin has >2000 counts, and if more than 50% of those come from <1% of pixels, then it is considered to be noise-dominated and hence unusable.
| Quadrant | # 1 sec bins | Bins with >0 counts | Bins with >2000 counts | High rate bins dominated by noise | Noise dominated (total time) | Noise dominated (detector-on time) | Marked lightcurve |
|---|---|---|---|---|---|---|---|
| A | 60131 | 52575 | 0 | 0 | 0.00% | 0.00% |  |
| B | 60131 | 52569 | 1 | 1 | 0.00% | 0.00% | 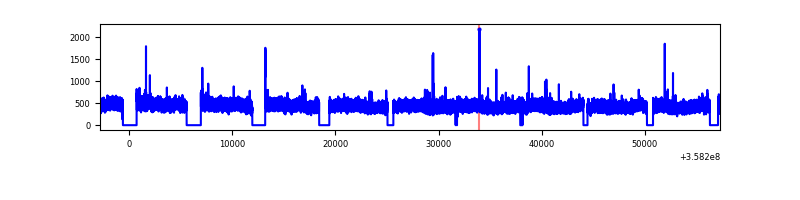 |
| C | 60131 | 52567 | 0 | 0 | 0.00% | 0.00% | 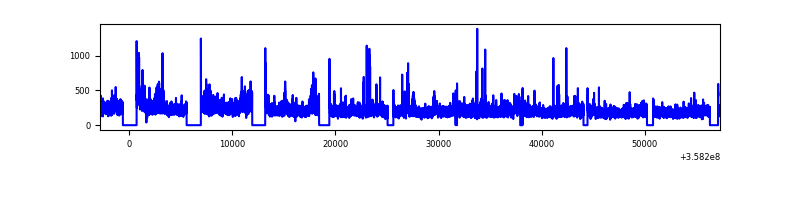 |
| D | 60131 | 52572 | 575 | 575 | 0.96% | 1.09% |  |
Top three noisy pixels from each quadrant. If the there are fewer than three noisy pixels in the level2.evt file, extra rows are filled as -1
| Pixel properties | Quadrant properties | ||||||
|---|---|---|---|---|---|---|---|
| Quadrant | DetID | PixID | Counts | Sigma | Mean | Median | Sigma |
| A | 5 | 203 | 635393 | 1015.29 | 2900 | 2853 | 623.0 |
| A | 13 | 254 | 94107 | 146.47 | 2900 | 2853 | 623.0 |
| A | 8 | 192 | 94085 | 146.44 | 2900 | 2853 | 623.0 |
| B | 6 | 159 | 14492296 | 26620.11 | 2907 | 2845 | 544.3 |
| B | 3 | 209 | 97711 | 174.29 | 2907 | 2845 | 544.3 |
| B | 0 | 190 | 68847 | 121.26 | 2907 | 2845 | 544.3 |
| C | 3 | 233 | 1191512 | 1819.77 | 2795 | 2787 | 653.2 |
| C | 2 | 114 | 100171 | 149.08 | 2795 | 2787 | 653.2 |
| C | 14 | 254 | 81970 | 121.22 | 2795 | 2787 | 653.2 |
| D | 13 | 104 | 1407151 | 2157.94 | 2780 | 2704 | 650.8 |
| D | 1 | 52 | 1363464 | 2090.82 | 2780 | 2704 | 650.8 |
| D | 12 | 233 | 940182 | 1440.44 | 2780 | 2704 | 650.8 |
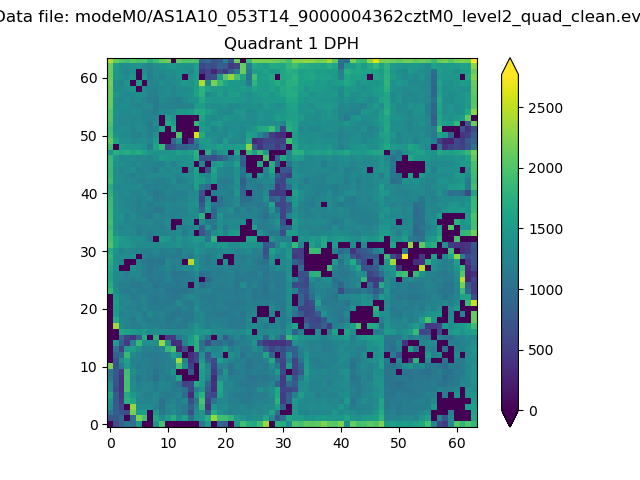
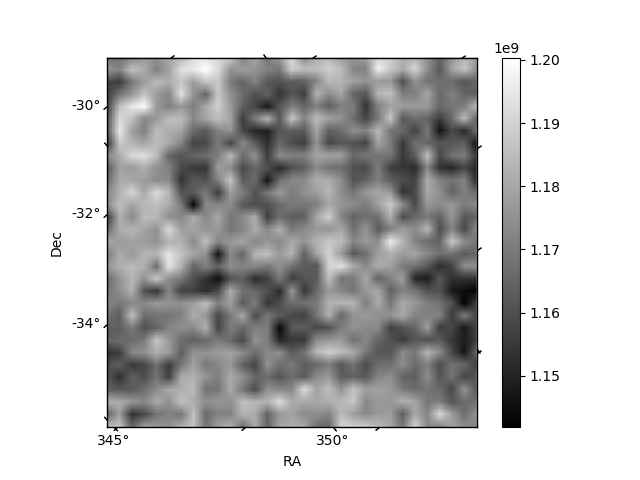
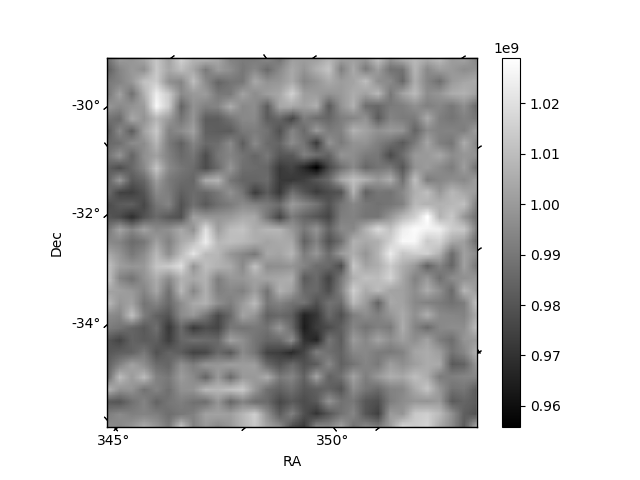
Histogram calculated using DETX and DETY for each event in the final _common_clean file
| Quadrant A |  |
 |
Quadrant B |
|---|---|---|---|
| Quadrant D |  |
 |
Quadrant C |
| Plot type | Count rate plots | Images |
|---|---|---|
| Comparison with Poisson distribution Blue bars denote a histogram of data divided into 1 sec bins. Red curve is a Poisson curve with rate = median count rate of data. |
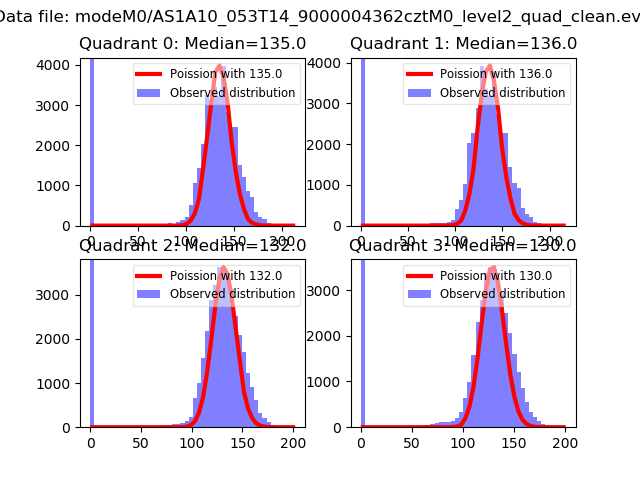 |
 |
| Quadrant-wise count rates Data is divided into 100 sec bins |
 |
|
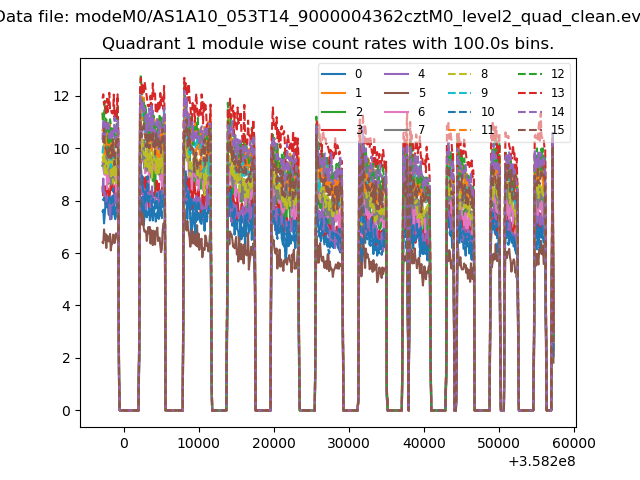
| Module-wise count rates for Quadrant A Data is divided into 100 sec bins |
 |
 |
| Module-wise count rates for Quadrant B Data is divided into 100 sec bins |
 |
 |
| Module-wise count rates for Quadrant C Data is divided into 100 sec bins |
 |
 |
| Module-wise count rates for Quadrant D Data is divided into 100 sec bins |
 |
 |
| Parameter | Plot |
|---|---|
| CZT HV Monitor |  |
| D_VDD | 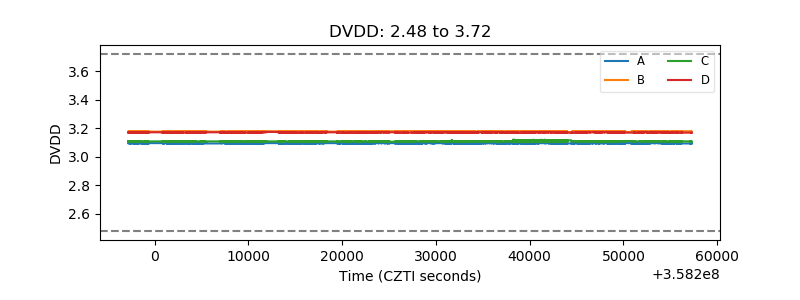 |
| Temperature 1 |  |
| Veto HV Monitor | 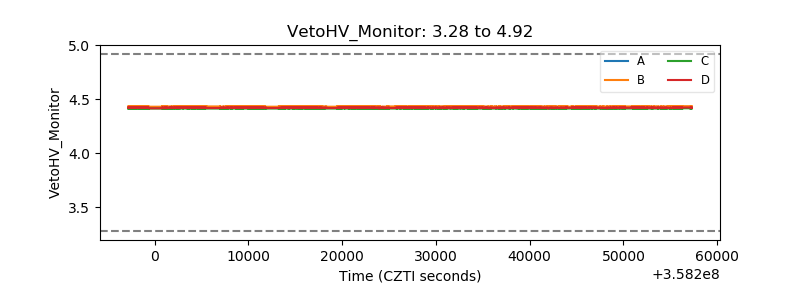 |
| Veto LLD |  |
| Alpha Counter |  |
| _CPM_Rate |  |
| CZT Counter |  |
| +2.5 Volts monitor |  |
| +5 Volts monitor |  |
| _ROLL_ROT |  |
| _Roll_DEC | 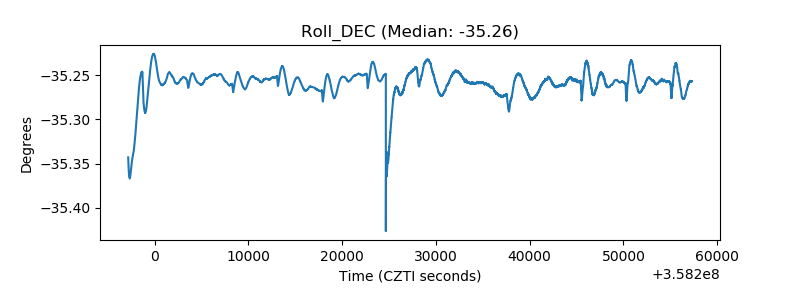 |
| _Roll_RA |  |
| Veto Counter | 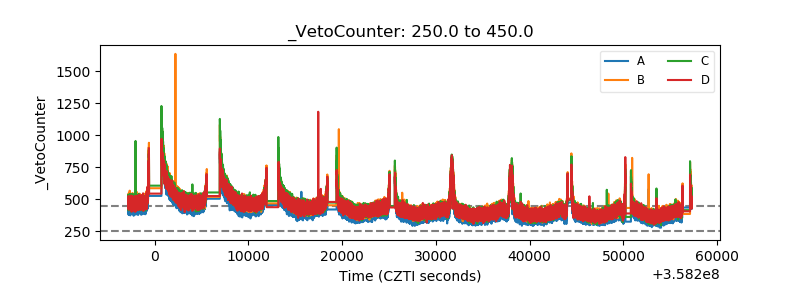 |