| Param | Original file | Final file |
|---|---|---|
| Filename | modeM0/AS1A10_071T23_9000004356cztM0_level2_bc.evt | modeM0/AS1A10_071T23_9000004356cztM0_level2_quad_clean.evt |
| Size (bytes) | 1,756,359,360 | 492,082,560 |
| Size | 1.6 GB | 469.3 MB |
| Events in quadrant A | 11,210,390 | 3,158,187 |
| Events in quadrant B | 19,856,572 | 3,155,646 |
| Events in quadrant C | 10,585,335 | 3,046,537 |
| Events in quadrant D | 9,053,525 | 3,036,883 |
| Mode M0 | |||
|---|---|---|---|
| Quadrant | BADHDUFLAG | Total packets | Discarded packets |
| A | 0 | 88086 | 0 |
| B | 0 | 118152 | 0 |
| C | 0 | 88406 | 0 |
| D | 0 | 79519 | 0 |
| Mode SS | |||
|---|---|---|---|
| Quadrant | BADHDUFLAG | Total packets | Discarded packets |
| A | 0 | 744 | 0 |
| B | 0 | 744 | 0 |
| C | 0 | 744 | 0 |
| D | 0 | 744 | 0 |
| Mode M9 | |||
|---|---|---|---|
| Quadrant | BADHDUFLAG | Total packets | Discarded packets |
| A | 0 | 42 | 0 |
| B | 0 | 42 | 0 |
| C | 0 | 42 | 0 |
| D | 0 | 42 | 0 |
| Quadrant | Total seconds | Saturated seconds | Saturation percentage |
|---|---|---|---|
| A | 36507 | 1713 | 4.692251% |
| B | 36507 | 1386 | 3.796532% |
| C | 36507 | 1430 | 3.917057% |
| D | 36507 | 506 | 1.386036% |
Noise dominated data is calculated using 1-second bins in cleaned event files. If a bin has >2000 counts, and if more than 50% of those come from <1% of pixels, then it is considered to be noise-dominated and hence unusable.
| Quadrant | # 1 sec bins | Bins with >0 counts | Bins with >2000 counts | High rate bins dominated by noise | Noise dominated (total time) | Noise dominated (detector-on time) | Marked lightcurve |
|---|---|---|---|---|---|---|---|
| A | 40627 | 36503 | 407 | 407 | 1.00% | 1.11% |  |
| B | 40627 | 36501 | 17 | 17 | 0.04% | 0.05% |  |
| C | 40627 | 36503 | 0 | 0 | 0.00% | 0.00% |  |
| D | 40627 | 36503 | 17 | 17 | 0.04% | 0.05% |  |
Top three noisy pixels from each quadrant. If the there are fewer than three noisy pixels in the level2.evt file, extra rows are filled as -1
| Pixel properties | Quadrant properties | ||||||
|---|---|---|---|---|---|---|---|
| Quadrant | DetID | PixID | Counts | Sigma | Mean | Median | Sigma |
| A | 14 | 239 | 3871825 | 9499.93 | 1873 | 1833 | 407.4 |
| A | 8 | 192 | 66393 | 158.48 | 1873 | 1833 | 407.4 |
| A | 13 | 254 | 59872 | 142.47 | 1873 | 1833 | 407.4 |
| B | 6 | 159 | 9589969 | 26240.88 | 1889 | 1841 | 365.4 |
| B | 6 | 36 | 2774664 | 7588.69 | 1889 | 1841 | 365.4 |
| B | 0 | 183 | 155502 | 420.54 | 1889 | 1841 | 365.4 |
| C | 3 | 233 | 3483796 | 8032.87 | 1817 | 1804 | 433.5 |
| C | 2 | 114 | 68697 | 154.32 | 1817 | 1804 | 433.5 |
| C | 14 | 254 | 42637 | 94.2 | 1817 | 1804 | 433.5 |
| D | 8 | 195 | 678855 | 1433.33 | 1858 | 1803 | 472.4 |
| D | 13 | 104 | 641173 | 1353.55 | 1858 | 1803 | 472.4 |
| D | 2 | 250 | 261240 | 549.23 | 1858 | 1803 | 472.4 |
Histogram calculated using DETX and DETY for each event in the final _common_clean file
| Quadrant A |  |
 |
Quadrant B |
|---|---|---|---|
| Quadrant D |  |
 |
Quadrant C |
| Plot type | Count rate plots | Images |
|---|---|---|
| Comparison with Poisson distribution Blue bars denote a histogram of data divided into 1 sec bins. Red curve is a Poisson curve with rate = median count rate of data. |
 |
 |
| Quadrant-wise count rates Data is divided into 100 sec bins |
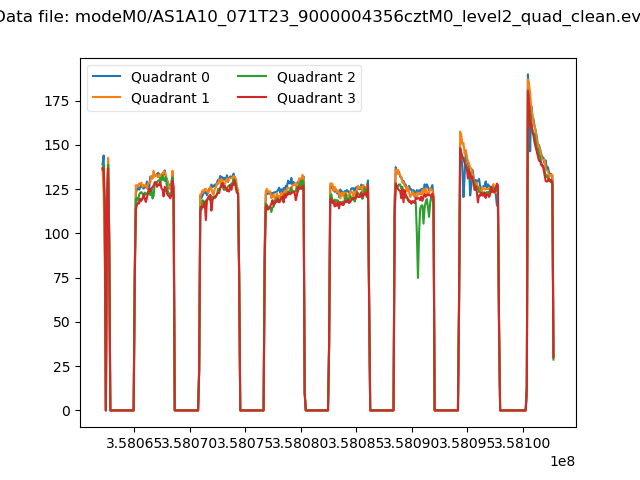 |
|
| Module-wise count rates for Quadrant A Data is divided into 100 sec bins |
 |
 |
| Module-wise count rates for Quadrant B Data is divided into 100 sec bins |
 |
 |
| Module-wise count rates for Quadrant C Data is divided into 100 sec bins |
 |
 |
| Module-wise count rates for Quadrant D Data is divided into 100 sec bins |
 |
 |
| Parameter | Plot |
|---|---|
| CZT HV Monitor |  |
| D_VDD |  |
| Temperature 1 |  |
| Veto HV Monitor |  |
| Veto LLD |  |
| Alpha Counter |  |
| _CPM_Rate | 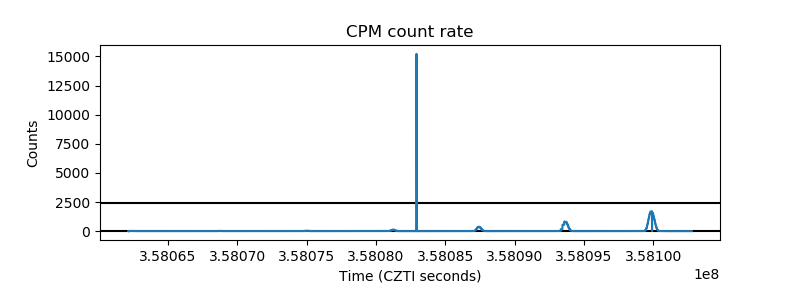 |
| CZT Counter | 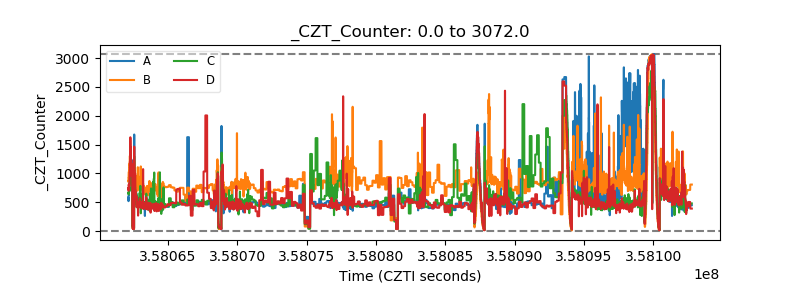 |
| +2.5 Volts monitor |  |
| +5 Volts monitor |  |
| _ROLL_ROT |  |
| _Roll_DEC |  |
| _Roll_RA |  |
| Veto Counter |  |