| Param | Original file | Final file |
|---|---|---|
| Filename | modeM0/AS1A10_071T20_9000004354cztM0_level2_bc.evt | modeM0/AS1A10_071T20_9000004354cztM0_level2_quad_clean.evt |
| Size (bytes) | 240,382,080 | 66,660,480 |
| Size | 229.2 MB | 63.6 MB |
| Events in quadrant A | 1,173,243 | 426,612 |
| Events in quadrant B | 2,915,926 | 426,863 |
| Events in quadrant C | 1,479,182 | 379,078 |
| Events in quadrant D | 1,330,087 | 402,019 |
| Mode SS | |||
|---|---|---|---|
| Quadrant | BADHDUFLAG | Total packets | Discarded packets |
| A | 0 | 110 | 0 |
| B | 0 | 110 | 0 |
| C | 0 | 110 | 0 |
| D | 0 | 110 | 0 |
| Mode M0 | |||
|---|---|---|---|
| Quadrant | BADHDUFLAG | Total packets | Discarded packets |
| A | 0 | 11274 | 0 |
| B | 0 | 17518 | 0 |
| C | 0 | 14727 | 0 |
| D | 0 | 11915 | 0 |
| Mode M9 | |||
|---|---|---|---|
| Quadrant | BADHDUFLAG | Total packets | Discarded packets |
| A | 0 | 3 | 0 |
| B | 0 | 4 | 0 |
| C | 0 | 4 | 0 |
| D | 0 | 4 | 0 |
| Quadrant | Total seconds | Saturated seconds | Saturation percentage |
|---|---|---|---|
| A | 5476 | 35 | 0.639153% |
| B | 5476 | 125 | 2.282688% |
| C | 5476 | 1547 | 28.250548% |
| D | 5476 | 64 | 1.168736% |
Noise dominated data is calculated using 1-second bins in cleaned event files. If a bin has >2000 counts, and if more than 50% of those come from <1% of pixels, then it is considered to be noise-dominated and hence unusable.
| Quadrant | # 1 sec bins | Bins with >0 counts | Bins with >2000 counts | High rate bins dominated by noise | Noise dominated (total time) | Noise dominated (detector-on time) | Marked lightcurve |
|---|---|---|---|---|---|---|---|
| A | 5475 | 5475 | 0 | 0 | 0.00% | 0.00% | 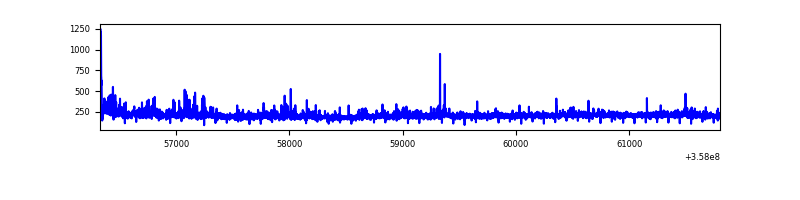 |
| B | 5475 | 5475 | 0 | 0 | 0.00% | 0.00% |  |
| C | 5475 | 5475 | 0 | 0 | 0.00% | 0.00% |  |
| D | 5475 | 5475 | 12 | 12 | 0.22% | 0.22% |  |
Top three noisy pixels from each quadrant. If the there are fewer than three noisy pixels in the level2.evt file, extra rows are filled as -1
| Pixel properties | Quadrant properties | ||||||
|---|---|---|---|---|---|---|---|
| Quadrant | DetID | PixID | Counts | Sigma | Mean | Median | Sigma |
| A | 14 | 239 | 74256 | 1160.37 | 281 | 274 | 63.8 |
| A | 8 | 192 | 9730 | 148.31 | 281 | 274 | 63.8 |
| A | 13 | 254 | 8328 | 126.32 | 281 | 274 | 63.8 |
| B | 6 | 159 | 1413964 | 24681.0 | 282 | 275 | 57.3 |
| B | 6 | 36 | 412699 | 7200.34 | 282 | 275 | 57.3 |
| B | 0 | 190 | 4772 | 78.51 | 282 | 275 | 57.3 |
| C | 14 | 254 | 290226 | 4720.48 | 249 | 246 | 61.4 |
| C | 3 | 233 | 212662 | 3457.84 | 249 | 246 | 61.4 |
| C | 2 | 114 | 9569 | 151.77 | 249 | 246 | 61.4 |
| D | 13 | 249 | 139118 | 2067.33 | 273 | 264 | 67.2 |
| D | 1 | 52 | 41887 | 619.7 | 273 | 264 | 67.2 |
| D | 2 | 250 | 33392 | 493.23 | 273 | 264 | 67.2 |
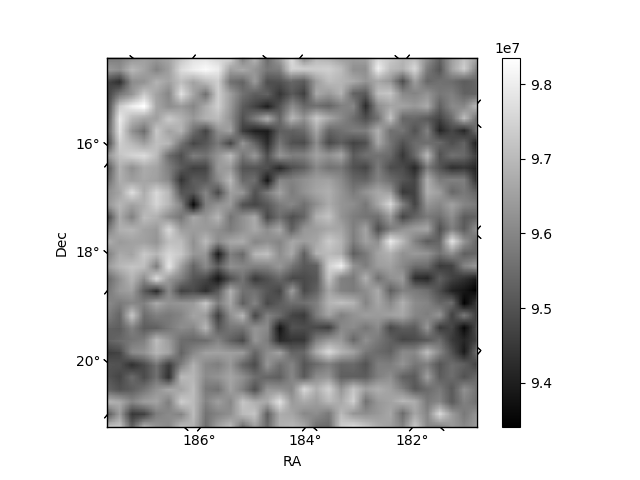
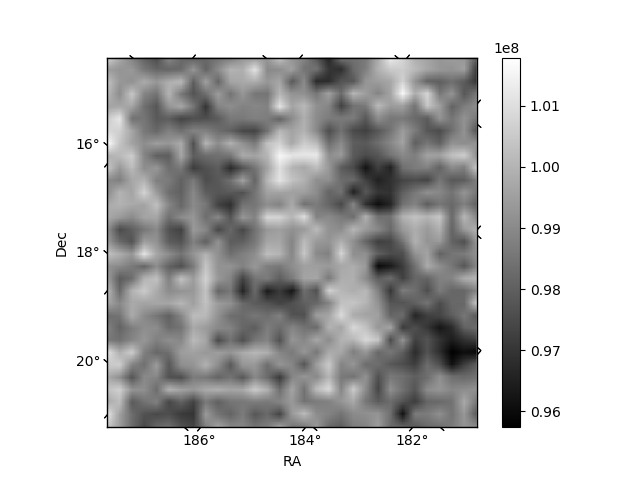
Histogram calculated using DETX and DETY for each event in the final _common_clean file
| Quadrant A |  |
 |
Quadrant B |
|---|---|---|---|
| Quadrant D | 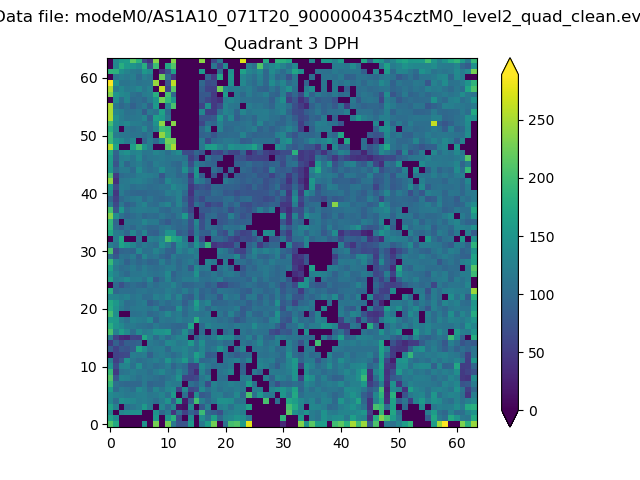 |
 |
Quadrant C |
| Plot type | Count rate plots | Images |
|---|---|---|
| Comparison with Poisson distribution Blue bars denote a histogram of data divided into 1 sec bins. Red curve is a Poisson curve with rate = median count rate of data. |
 |
 |
| Quadrant-wise count rates Data is divided into 100 sec bins |
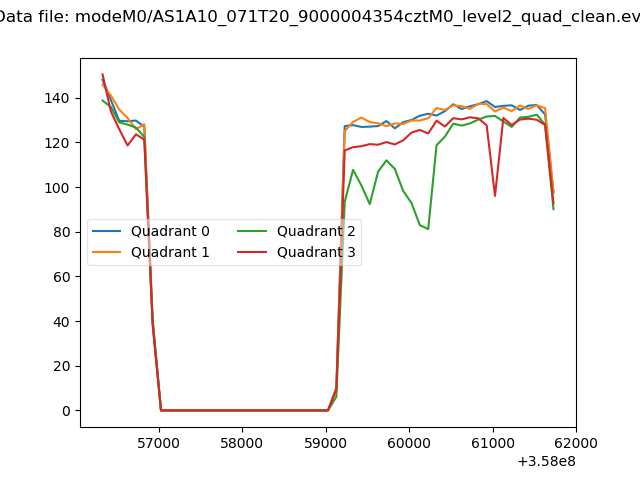 |
|
| Module-wise count rates for Quadrant A Data is divided into 100 sec bins |
 |
 |
| Module-wise count rates for Quadrant B Data is divided into 100 sec bins |
 |
 |
| Module-wise count rates for Quadrant C Data is divided into 100 sec bins |
 |
 |
| Module-wise count rates for Quadrant D Data is divided into 100 sec bins |
 |
 |
| Parameter | Plot |
|---|---|
| CZT HV Monitor |  |
| D_VDD |  |
| Temperature 1 |  |
| Veto HV Monitor |  |
| Veto LLD | 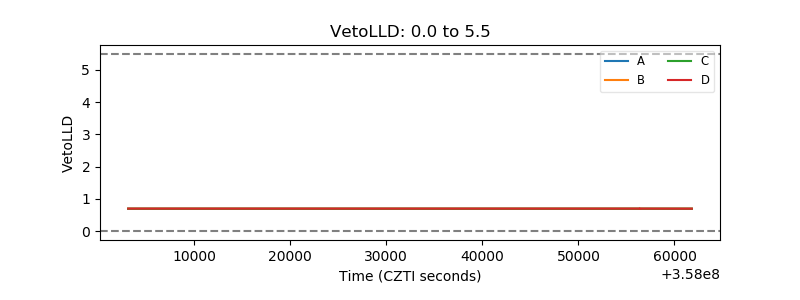 |
| Alpha Counter |  |
| _CPM_Rate |  |
| CZT Counter |  |
| +2.5 Volts monitor |  |
| +5 Volts monitor | 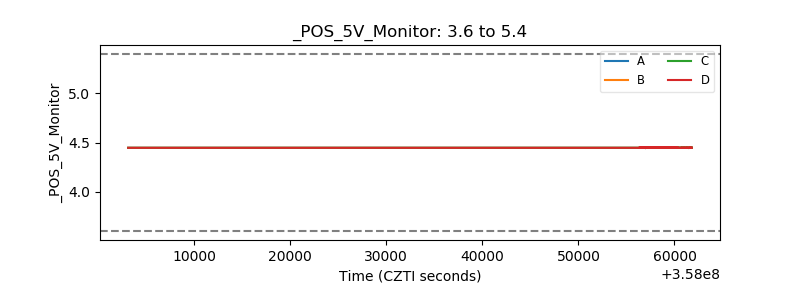 |
| _ROLL_ROT | 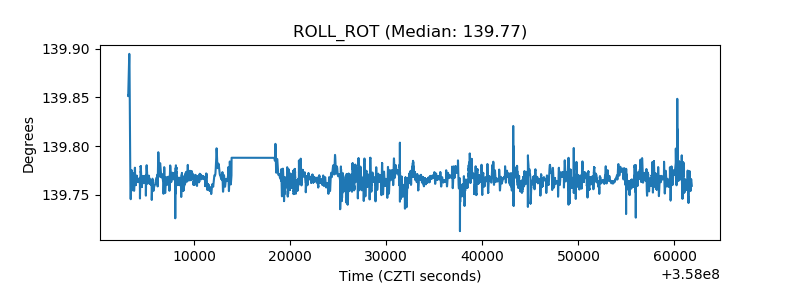 |
| _Roll_DEC |  |
| _Roll_RA |  |
| Veto Counter |  |