| Param | Original file | Final file |
|---|---|---|
| Filename | modeM0/AS1A10_071T17_9000004352cztM0_level2_bc.evt | modeM0/AS1A10_071T17_9000004352cztM0_level2_quad_clean.evt |
| Size (bytes) | 2,085,865,920 | 637,752,960 |
| Size | 1.9 GB | 608.2 MB |
| Events in quadrant A | 10,315,270 | 4,100,419 |
| Events in quadrant B | 23,408,812 | 4,126,273 |
| Events in quadrant C | 10,377,751 | 3,919,171 |
| Events in quadrant D | 15,744,956 | 3,821,262 |
| Mode M9 | |||
|---|---|---|---|
| Quadrant | BADHDUFLAG | Total packets | Discarded packets |
| A | 0 | 66 | 0 |
| B | 0 | 68 | 0 |
| C | 0 | 68 | 0 |
| D | 0 | 68 | 0 |
| Mode M0 | |||
|---|---|---|---|
| Quadrant | BADHDUFLAG | Total packets | Discarded packets |
| A | 0 | 101502 | 0 |
| B | 0 | 148093 | 0 |
| C | 0 | 104272 | 0 |
| D | 0 | 120798 | 0 |
| Mode SS | |||
|---|---|---|---|
| Quadrant | BADHDUFLAG | Total packets | Discarded packets |
| A | 0 | 996 | 0 |
| B | 0 | 996 | 0 |
| C | 0 | 996 | 0 |
| D | 0 | 996 | 0 |
| Quadrant | Total seconds | Saturated seconds | Saturation percentage |
|---|---|---|---|
| A | 48786 | 663 | 1.358996% |
| B | 48786 | 1119 | 2.293691% |
| C | 48786 | 1707 | 3.498955% |
| D | 48786 | 1754 | 3.595294% |
Noise dominated data is calculated using 1-second bins in cleaned event files. If a bin has >2000 counts, and if more than 50% of those come from <1% of pixels, then it is considered to be noise-dominated and hence unusable.
| Quadrant | # 1 sec bins | Bins with >0 counts | Bins with >2000 counts | High rate bins dominated by noise | Noise dominated (total time) | Noise dominated (detector-on time) | Marked lightcurve |
|---|---|---|---|---|---|---|---|
| A | 59126 | 48783 | 0 | 0 | 0.00% | 0.00% |  |
| B | 59126 | 48784 | 0 | 0 | 0.00% | 0.00% |  |
| C | 59126 | 48780 | 2 | 2 | 0.00% | 0.00% | 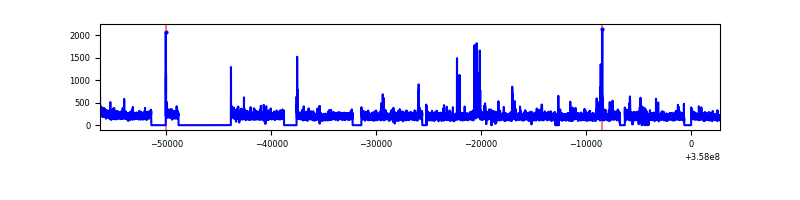 |
| D | 59126 | 48782 | 109 | 109 | 0.18% | 0.22% |  |
Top three noisy pixels from each quadrant. If the there are fewer than three noisy pixels in the level2.evt file, extra rows are filled as -1
| Pixel properties | Quadrant properties | ||||||
|---|---|---|---|---|---|---|---|
| Quadrant | DetID | PixID | Counts | Sigma | Mean | Median | Sigma |
| A | 14 | 239 | 126003 | 220.22 | 2614 | 2570 | 560.5 |
| A | 8 | 192 | 98470 | 171.1 | 2614 | 2570 | 560.5 |
| A | 13 | 254 | 81742 | 141.25 | 2614 | 2570 | 560.5 |
| B | 6 | 159 | 12983458 | 25929.71 | 2640 | 2578 | 500.6 |
| B | 6 | 36 | 192601 | 379.58 | 2640 | 2578 | 500.6 |
| B | 0 | 190 | 121731 | 238.01 | 2640 | 2578 | 500.6 |
| C | 3 | 233 | 317392 | 535.47 | 2507 | 2498 | 588.1 |
| C | 10 | 22 | 170759 | 286.12 | 2507 | 2498 | 588.1 |
| C | 14 | 254 | 125924 | 209.88 | 2507 | 2498 | 588.1 |
| D | 13 | 104 | 1918987 | 3207.97 | 2518 | 2452 | 597.4 |
| D | 8 | 195 | 1319331 | 2204.24 | 2518 | 2452 | 597.4 |
| D | 1 | 52 | 1161794 | 1940.55 | 2518 | 2452 | 597.4 |
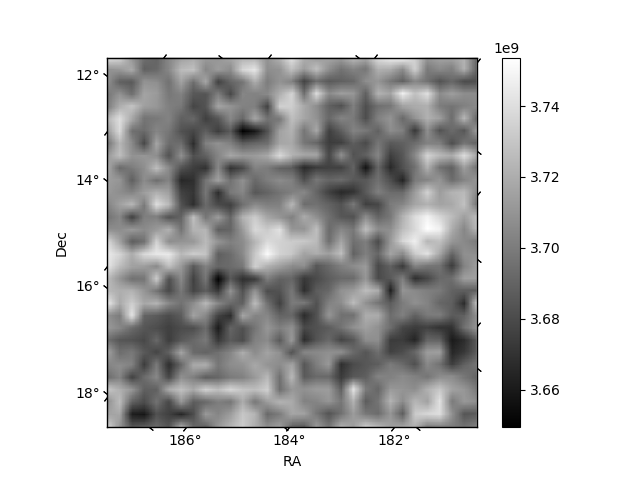
Histogram calculated using DETX and DETY for each event in the final _common_clean file
| Quadrant A |  |
 |
Quadrant B |
|---|---|---|---|
| Quadrant D |  |
 |
Quadrant C |
| Plot type | Count rate plots | Images |
|---|---|---|
| Comparison with Poisson distribution Blue bars denote a histogram of data divided into 1 sec bins. Red curve is a Poisson curve with rate = median count rate of data. |
 |
 |
| Quadrant-wise count rates Data is divided into 100 sec bins |
 |
|
| Module-wise count rates for Quadrant A Data is divided into 100 sec bins |
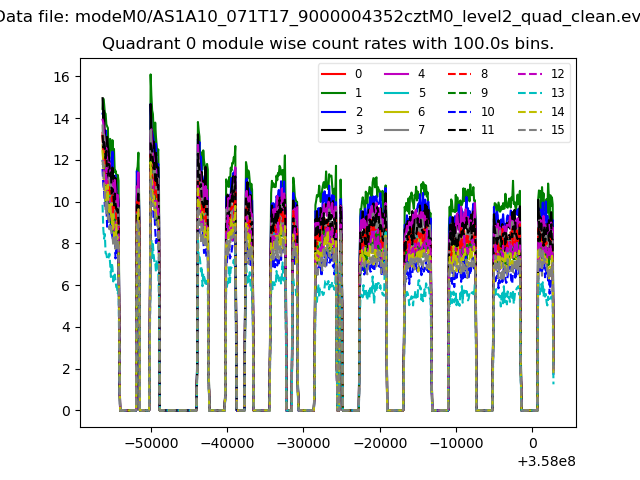 |
 |
| Module-wise count rates for Quadrant B Data is divided into 100 sec bins |
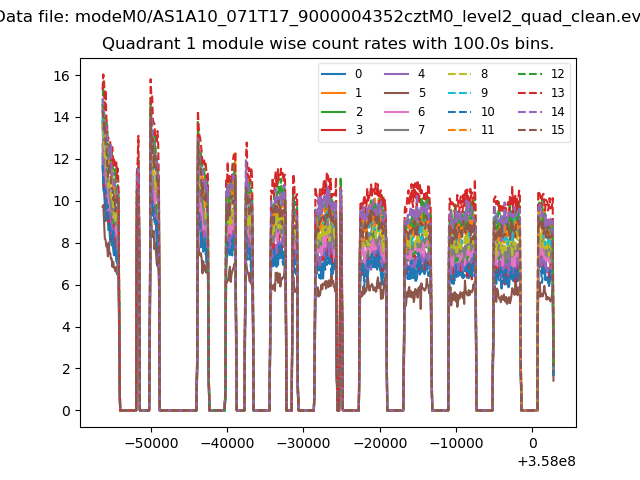 |
 |
| Module-wise count rates for Quadrant C Data is divided into 100 sec bins |
 |
 |
| Module-wise count rates for Quadrant D Data is divided into 100 sec bins |
 |
 |
| Parameter | Plot |
|---|---|
| CZT HV Monitor |  |
| D_VDD |  |
| Temperature 1 |  |
| Veto HV Monitor |  |
| Veto LLD | 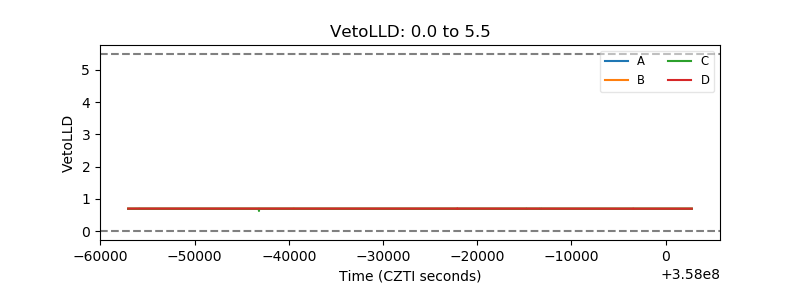 |
| Alpha Counter |  |
| _CPM_Rate | 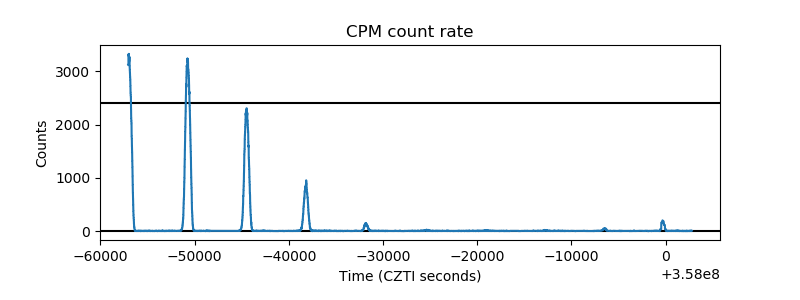 |
| CZT Counter |  |
| +2.5 Volts monitor |  |
| +5 Volts monitor |  |
| _ROLL_ROT |  |
| _Roll_DEC |  |
| _Roll_RA |  |
| Veto Counter |  |