| Param | Original file | Final file |
|---|---|---|
| Filename | modeM0/AS1A10_007T01_9000004350cztM0_level2_bc.evt | modeM0/AS1A10_007T01_9000004350cztM0_level2_quad_clean.evt |
| Size (bytes) | 17,871,877,440 | 4,729,852,800 |
| Size | 16.6 GB | 4.4 GB |
| Events in quadrant A | 89,941,325 | 30,340,115 |
| Events in quadrant B | 222,545,944 | 28,784,971 |
| Events in quadrant C | 83,536,193 | 30,309,829 |
| Events in quadrant D | 121,104,703 | 29,502,578 |
| Mode M9 | |||
|---|---|---|---|
| Quadrant | BADHDUFLAG | Total packets | Discarded packets |
| A | 0 | 554 | 0 |
| B | 0 | 554 | 0 |
| C | 0 | 554 | 0 |
| D | 0 | 554 | 0 |
| Mode SS | |||
|---|---|---|---|
| Quadrant | BADHDUFLAG | Total packets | Discarded packets |
| A | 0 | 7232 | 0 |
| B | 0 | 7230 | 0 |
| C | 0 | 7228 | 0 |
| D | 0 | 7224 | 0 |
| Mode M0 | |||
|---|---|---|---|
| Quadrant | BADHDUFLAG | Total packets | Discarded packets |
| A | 0 | 790823 | 0 |
| B | 0 | 1339279 | 0 |
| C | 0 | 779404 | 0 |
| D | 0 | 887003 | 0 |
| Quadrant | Total seconds | Saturated seconds | Saturation percentage |
|---|---|---|---|
| A | 355118 | 8845 | 2.490721% |
| B | 354789 | 56160 | 15.829127% |
| C | 355164 | 9414 | 2.650606% |
| D | 355142 | 11768 | 3.313604% |
Noise dominated data is calculated using 1-second bins in cleaned event files. If a bin has >2000 counts, and if more than 50% of those come from <1% of pixels, then it is considered to be noise-dominated and hence unusable.
| Quadrant | # 1 sec bins | Bins with >0 counts | Bins with >2000 counts | High rate bins dominated by noise | Noise dominated (total time) | Noise dominated (detector-on time) | Marked lightcurve |
|---|---|---|---|---|---|---|---|
| A | 418542 | 355664 | 1300 | 1300 | 0.31% | 0.37% | 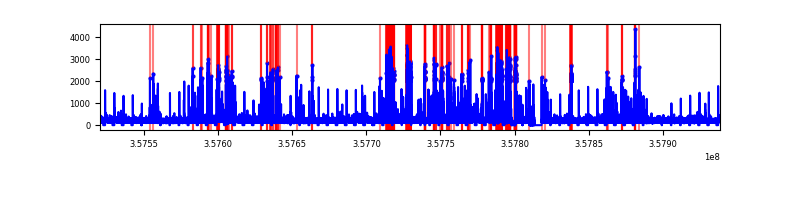 |
| B | 418542 | 355335 | 1099 | 1099 | 0.26% | 0.31% |  |
| C | 418542 | 355737 | 11 | 11 | 0.00% | 0.00% | 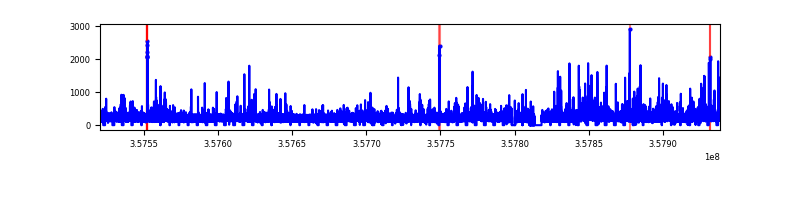 |
| D | 418542 | 355757 | 1568 | 1568 | 0.37% | 0.44% |  |
Top three noisy pixels from each quadrant. If the there are fewer than three noisy pixels in the level2.evt file, extra rows are filled as -1
| Pixel properties | Quadrant properties | ||||||
|---|---|---|---|---|---|---|---|
| Quadrant | DetID | PixID | Counts | Sigma | Mean | Median | Sigma |
| A | 14 | 239 | 11617972 | 2844.91 | 19221 | 18917 | 4077.1 |
| A | 0 | 13 | 3081999 | 751.28 | 19221 | 18917 | 4077.1 |
| A | 8 | 192 | 654688 | 155.94 | 19221 | 18917 | 4077.1 |
| B | 6 | 159 | 89812893 | 26217.83 | 18230 | 17800 | 3425.0 |
| B | 6 | 36 | 59457515 | 17354.85 | 18230 | 17800 | 3425.0 |
| B | 4 | 80 | 1398605 | 403.16 | 18230 | 17800 | 3425.0 |
| C | 3 | 233 | 9063702 | 2012.21 | 18957 | 18882 | 4495.0 |
| C | 2 | 114 | 674114 | 145.77 | 18957 | 18882 | 4495.0 |
| C | 14 | 254 | 467557 | 99.82 | 18957 | 18882 | 4495.0 |
| D | 1 | 52 | 17355037 | 3928.52 | 18941 | 18446 | 4413.0 |
| D | 8 | 195 | 14317151 | 3240.13 | 18941 | 18446 | 4413.0 |
| D | 2 | 250 | 4350113 | 981.57 | 18941 | 18446 | 4413.0 |
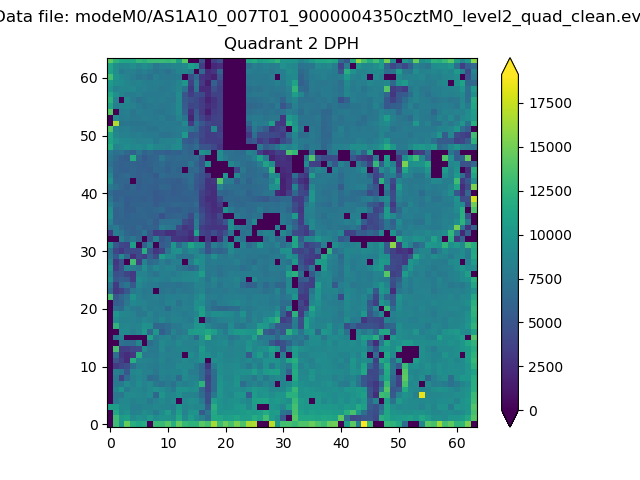
Histogram calculated using DETX and DETY for each event in the final _common_clean file
| Quadrant A |  |
 |
Quadrant B |
|---|---|---|---|
| Quadrant D | 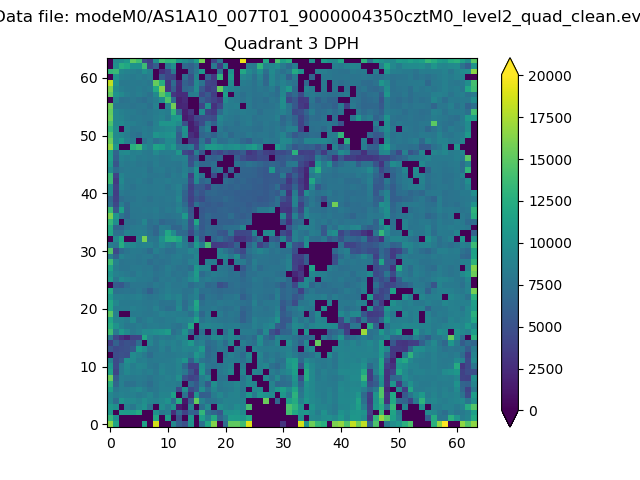 |
 |
Quadrant C |
| Plot type | Count rate plots | Images |
|---|---|---|
| Comparison with Poisson distribution Blue bars denote a histogram of data divided into 1 sec bins. Red curve is a Poisson curve with rate = median count rate of data. |
 |
 |
| Quadrant-wise count rates Data is divided into 100 sec bins |
 |
|
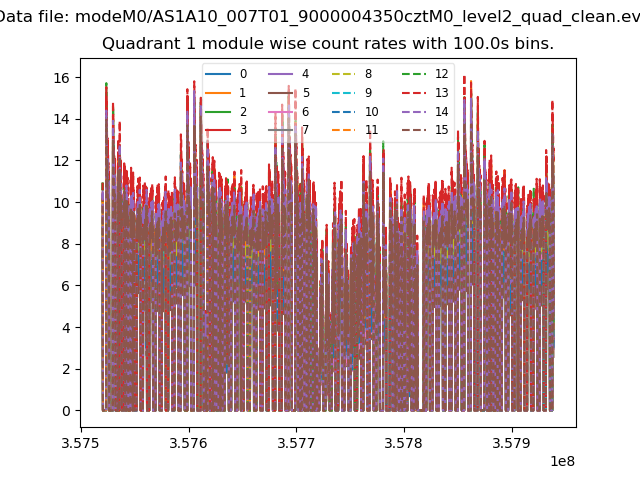
| Module-wise count rates for Quadrant A Data is divided into 100 sec bins |
 |
 |
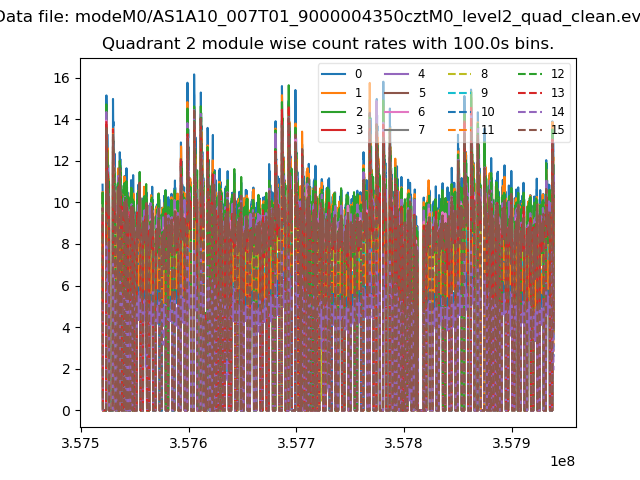
| Module-wise count rates for Quadrant B Data is divided into 100 sec bins |
 |
 |
| Module-wise count rates for Quadrant C Data is divided into 100 sec bins |
 |
 |
| Module-wise count rates for Quadrant D Data is divided into 100 sec bins |
 |
 |
| Parameter | Plot |
|---|---|
| CZT HV Monitor |  |
| D_VDD |  |
| Temperature 1 | 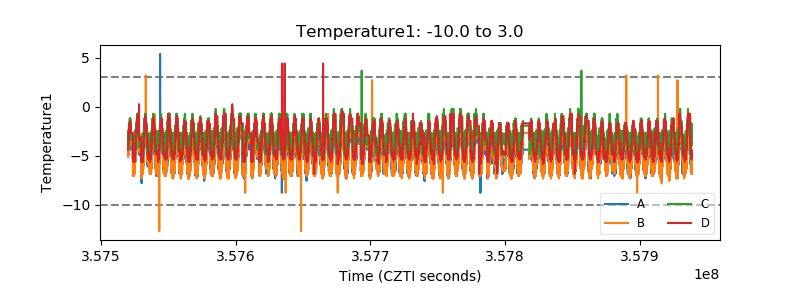 |
| Veto HV Monitor | 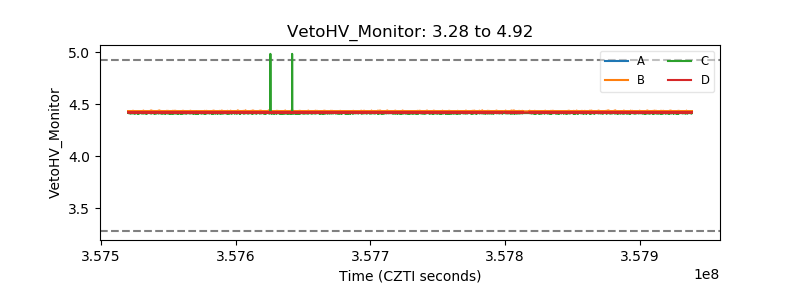 |
| Veto LLD | 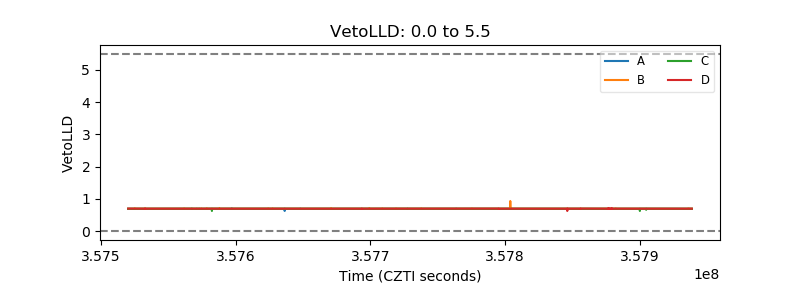 |
| Alpha Counter | 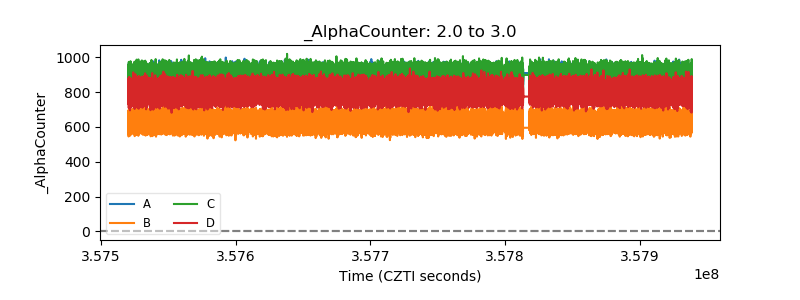 |
| _CPM_Rate |  |
| CZT Counter |  |
| +2.5 Volts monitor |  |
| +5 Volts monitor |  |
| _ROLL_ROT |  |
| _Roll_DEC |  |
| _Roll_RA |  |
| Veto Counter |  |