| Param | Original file | Final file |
|---|---|---|
| Filename | modeM0/AS1A10_071T15_9000004346cztM0_level2_bc.evt | modeM0/AS1A10_071T15_9000004346cztM0_level2_quad_clean.evt |
| Size (bytes) | 2,536,980,480 | 666,334,080 |
| Size | 2.4 GB | 635.5 MB |
| Events in quadrant A | 11,819,463 | 4,222,140 |
| Events in quadrant B | 26,448,470 | 4,256,547 |
| Events in quadrant C | 14,265,948 | 4,051,443 |
| Events in quadrant D | 20,593,418 | 3,914,183 |
| Mode SS | |||
|---|---|---|---|
| Quadrant | BADHDUFLAG | Total packets | Discarded packets |
| A | 0 | 1112 | 0 |
| B | 0 | 1112 | 0 |
| C | 0 | 1112 | 0 |
| D | 0 | 1112 | 0 |
| Mode M0 | |||
|---|---|---|---|
| Quadrant | BADHDUFLAG | Total packets | Discarded packets |
| A | 0 | 114086 | 0 |
| B | 0 | 165134 | 0 |
| C | 0 | 123200 | 0 |
| D | 0 | 140849 | 0 |
| Mode M9 | |||
|---|---|---|---|
| Quadrant | BADHDUFLAG | Total packets | Discarded packets |
| A | 0 | 104 | 0 |
| B | 0 | 104 | 0 |
| C | 0 | 104 | 0 |
| D | 0 | 104 | 0 |
| Quadrant | Total seconds | Saturated seconds | Saturation percentage |
|---|---|---|---|
| A | 54467 | 742 | 1.362293% |
| B | 54468 | 1284 | 2.357347% |
| C | 54468 | 1995 | 3.662701% |
| D | 54468 | 1839 | 3.376294% |
Noise dominated data is calculated using 1-second bins in cleaned event files. If a bin has >2000 counts, and if more than 50% of those come from <1% of pixels, then it is considered to be noise-dominated and hence unusable.
| Quadrant | # 1 sec bins | Bins with >0 counts | Bins with >2000 counts | High rate bins dominated by noise | Noise dominated (total time) | Noise dominated (detector-on time) | Marked lightcurve |
|---|---|---|---|---|---|---|---|
| A | 68811 | 54467 | 0 | 0 | 0.00% | 0.00% |  |
| B | 68811 | 54468 | 1 | 1 | 0.00% | 0.00% |  |
| C | 68811 | 54469 | 441 | 441 | 0.64% | 0.81% | 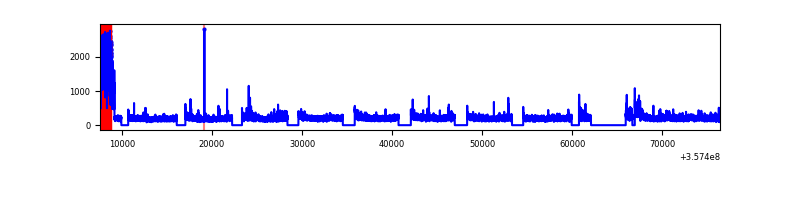 |
| D | 68811 | 54469 | 331 | 331 | 0.48% | 0.61% |  |
Top three noisy pixels from each quadrant. If the there are fewer than three noisy pixels in the level2.evt file, extra rows are filled as -1
| Pixel properties | Quadrant properties | ||||||
|---|---|---|---|---|---|---|---|
| Quadrant | DetID | PixID | Counts | Sigma | Mean | Median | Sigma |
| A | 8 | 192 | 116256 | 175.02 | 3025 | 2970 | 647.3 |
| A | 13 | 254 | 89513 | 133.7 | 3025 | 2970 | 647.3 |
| A | 0 | 226 | 18857 | 24.54 | 3025 | 2970 | 647.3 |
| B | 6 | 159 | 14670114 | 25370.04 | 3057 | 2984 | 578.1 |
| B | 0 | 190 | 93248 | 156.13 | 3057 | 2984 | 578.1 |
| B | 0 | 214 | 24045 | 36.43 | 3057 | 2984 | 578.1 |
| C | 3 | 233 | 2916597 | 4312.66 | 2899 | 2887 | 675.6 |
| C | 2 | 114 | 102973 | 148.14 | 2899 | 2887 | 675.6 |
| C | 10 | 22 | 47055 | 65.37 | 2899 | 2887 | 675.6 |
| D | 7 | 223 | 2481466 | 3711.03 | 2902 | 2828 | 667.9 |
| D | 1 | 52 | 2166662 | 3239.7 | 2902 | 2828 | 667.9 |
| D | 8 | 195 | 2057281 | 3075.94 | 2902 | 2828 | 667.9 |
Histogram calculated using DETX and DETY for each event in the final _common_clean file
| Quadrant A |  |
 |
Quadrant B |
|---|---|---|---|
| Quadrant D | 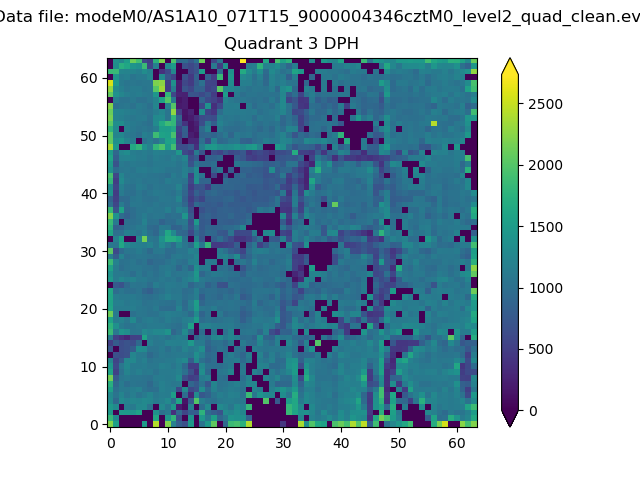 |
 |
Quadrant C |
| Plot type | Count rate plots | Images |
|---|---|---|
| Comparison with Poisson distribution Blue bars denote a histogram of data divided into 1 sec bins. Red curve is a Poisson curve with rate = median count rate of data. |
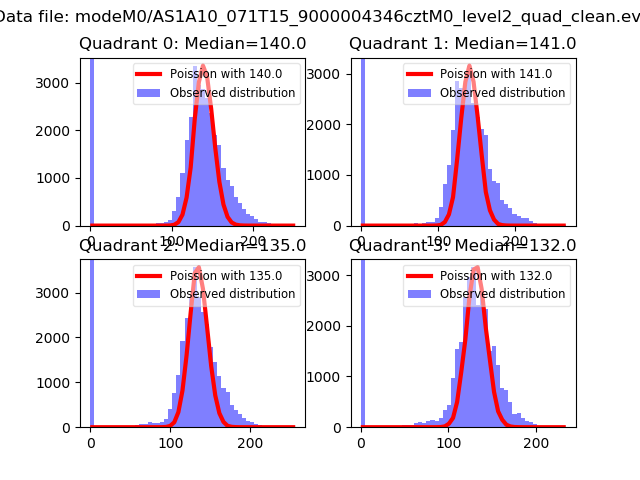 |
 |
| Quadrant-wise count rates Data is divided into 100 sec bins |
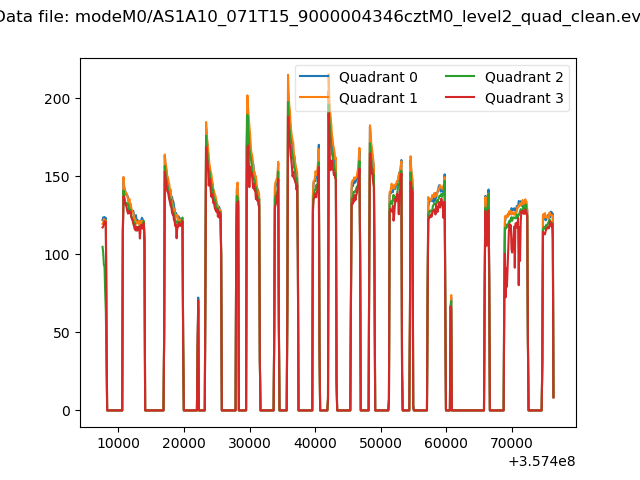 |
|
| Module-wise count rates for Quadrant A Data is divided into 100 sec bins |
 |
 |
| Module-wise count rates for Quadrant B Data is divided into 100 sec bins |
 |
 |
| Module-wise count rates for Quadrant C Data is divided into 100 sec bins |
 |
 |
| Module-wise count rates for Quadrant D Data is divided into 100 sec bins |
 |
 |
| Parameter | Plot |
|---|---|
| CZT HV Monitor |  |
| D_VDD |  |
| Temperature 1 |  |
| Veto HV Monitor |  |
| Veto LLD |  |
| Alpha Counter | 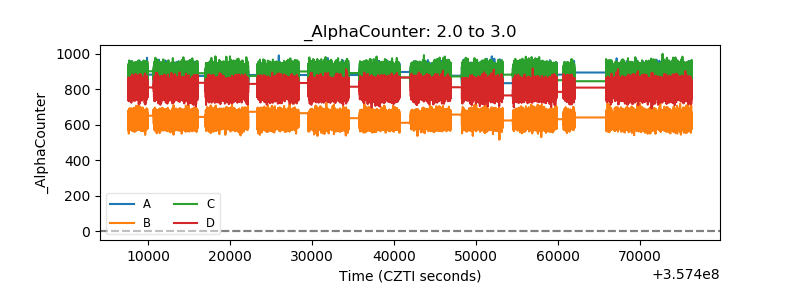 |
| _CPM_Rate |  |
| CZT Counter |  |
| +2.5 Volts monitor |  |
| +5 Volts monitor |  |
| _ROLL_ROT |  |
| _Roll_DEC | 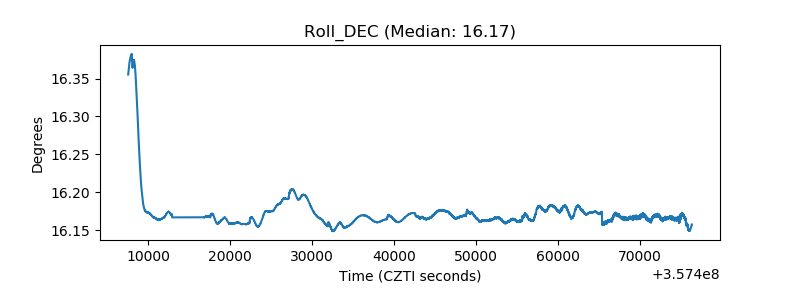 |
| _Roll_RA |  |
| Veto Counter |  |