| Param | Original file | Final file |
|---|---|---|
| Filename | modeM0/AS1A10_071T09_9000004344cztM0_level2_bc.evt | modeM0/AS1A10_071T09_9000004344cztM0_level2_quad_clean.evt |
| Size (bytes) | 3,272,325,120 | 688,392,000 |
| Size | 3.0 GB | 656.5 MB |
| Events in quadrant A | 12,290,153 | 4,416,733 |
| Events in quadrant B | 26,210,613 | 4,457,989 |
| Events in quadrant C | 37,842,421 | 4,069,851 |
| Events in quadrant D | 19,036,898 | 4,140,098 |
| Mode SS | |||
|---|---|---|---|
| Quadrant | BADHDUFLAG | Total packets | Discarded packets |
| A | 0 | 1114 | 0 |
| B | 0 | 1114 | 0 |
| C | 0 | 1114 | 0 |
| D | 0 | 1114 | 0 |
| Mode M0 | |||
|---|---|---|---|
| Quadrant | BADHDUFLAG | Total packets | Discarded packets |
| A | 0 | 116277 | 0 |
| B | 0 | 166206 | 0 |
| C | 0 | 203734 | 0 |
| D | 0 | 135351 | 0 |
| Mode M9 | |||
|---|---|---|---|
| Quadrant | BADHDUFLAG | Total packets | Discarded packets |
| A | 0 | 78 | 0 |
| B | 0 | 78 | 0 |
| C | 0 | 78 | 0 |
| D | 0 | 78 | 0 |
| Quadrant | Total seconds | Saturated seconds | Saturation percentage |
|---|---|---|---|
| A | 54874 | 1096 | 1.997303% |
| B | 54874 | 1572 | 2.864745% |
| C | 54874 | 5584 | 10.176040% |
| D | 54874 | 1402 | 2.554944% |
Noise dominated data is calculated using 1-second bins in cleaned event files. If a bin has >2000 counts, and if more than 50% of those come from <1% of pixels, then it is considered to be noise-dominated and hence unusable.
| Quadrant | # 1 sec bins | Bins with >0 counts | Bins with >2000 counts | High rate bins dominated by noise | Noise dominated (total time) | Noise dominated (detector-on time) | Marked lightcurve |
|---|---|---|---|---|---|---|---|
| A | 62669 | 54878 | 31 | 31 | 0.05% | 0.06% | 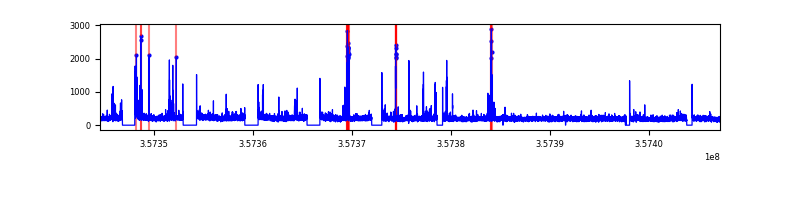 |
| B | 62669 | 54872 | 0 | 0 | 0.00% | 0.00% |  |
| C | 62669 | 54871 | 482 | 482 | 0.77% | 0.88% |  |
| D | 62669 | 54874 | 112 | 112 | 0.18% | 0.20% |  |
Top three noisy pixels from each quadrant. If the there are fewer than three noisy pixels in the level2.evt file, extra rows are filled as -1
| Pixel properties | Quadrant properties | ||||||
|---|---|---|---|---|---|---|---|
| Quadrant | DetID | PixID | Counts | Sigma | Mean | Median | Sigma |
| A | 0 | 13 | 506895 | 788.82 | 3008 | 2959 | 638.8 |
| A | 8 | 192 | 93841 | 142.26 | 3008 | 2959 | 638.8 |
| A | 13 | 254 | 90044 | 136.32 | 3008 | 2959 | 638.8 |
| B | 6 | 159 | 14544591 | 25267.45 | 3045 | 2976 | 575.5 |
| B | 0 | 230 | 24631 | 37.63 | 3045 | 2976 | 575.5 |
| B | 0 | 190 | 21326 | 31.88 | 3045 | 2976 | 575.5 |
| C | 3 | 233 | 26691261 | 40496.83 | 2824 | 2819 | 659.0 |
| C | 15 | 208 | 150892 | 224.68 | 2824 | 2819 | 659.0 |
| C | 2 | 114 | 102454 | 151.19 | 2824 | 2819 | 659.0 |
| D | 7 | 223 | 2550071 | 3742.71 | 2908 | 2828 | 680.6 |
| D | 8 | 195 | 2108790 | 3094.32 | 2908 | 2828 | 680.6 |
| D | 13 | 104 | 1708986 | 2506.89 | 2908 | 2828 | 680.6 |
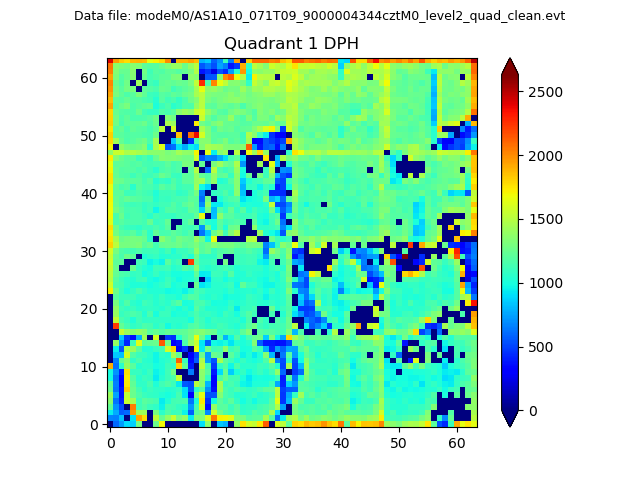
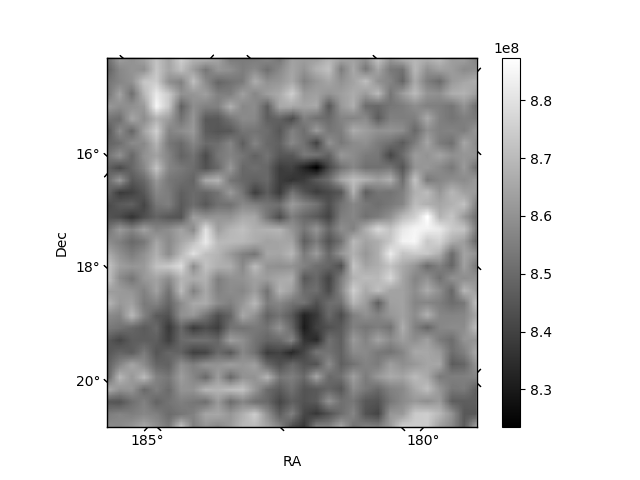
Histogram calculated using DETX and DETY for each event in the final _common_clean file
| Quadrant A |  |
 |
Quadrant B |
|---|---|---|---|
| Quadrant D | 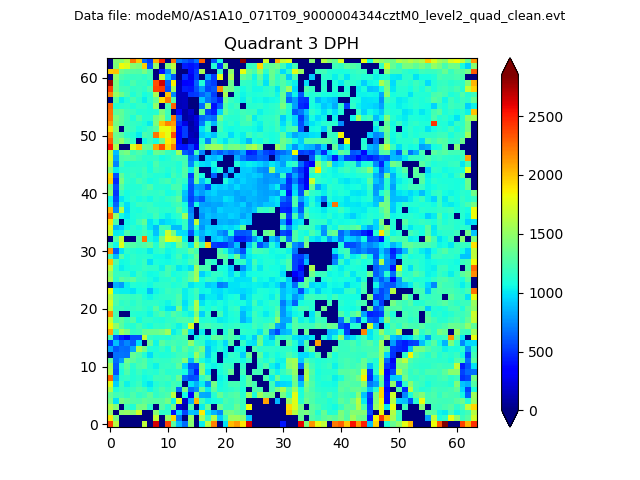 |
 |
Quadrant C |
| Plot type | Count rate plots | Images |
|---|---|---|
| Comparison with Poisson distribution Blue bars denote a histogram of data divided into 1 sec bins. Red curve is a Poisson curve with rate = median count rate of data. |
 |
 |
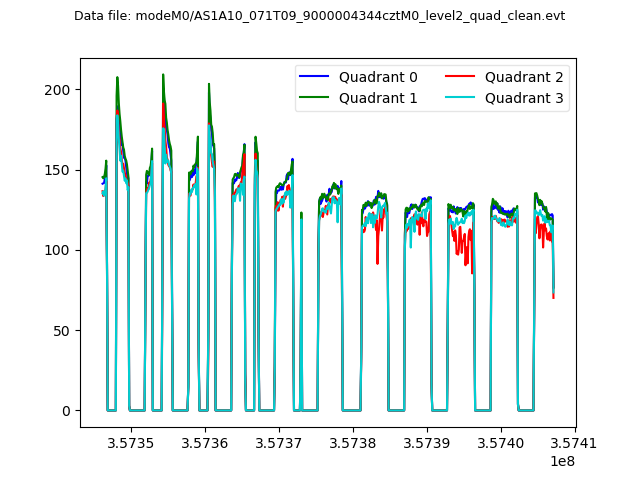
| Quadrant-wise count rates Data is divided into 100 sec bins |
 |
|
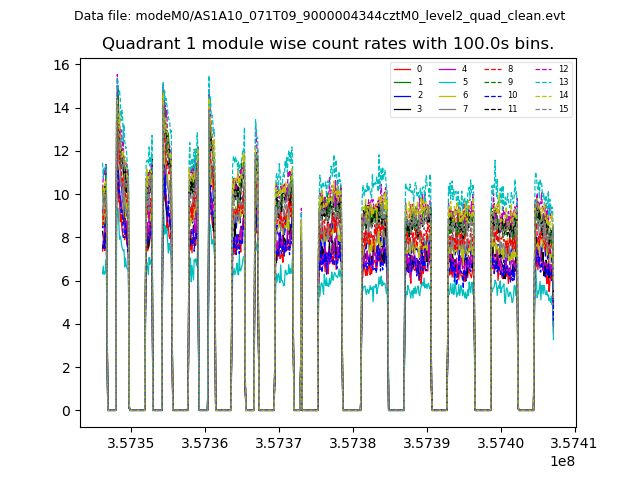
| Module-wise count rates for Quadrant A Data is divided into 100 sec bins |
 |
 |
| Module-wise count rates for Quadrant B Data is divided into 100 sec bins |
 |
 |
| Module-wise count rates for Quadrant C Data is divided into 100 sec bins |
 |
 |
| Module-wise count rates for Quadrant D Data is divided into 100 sec bins |
 |
 |
| Parameter | Plot |
|---|---|
| CZT HV Monitor |  |
| D_VDD |  |
| Temperature 1 |  |
| Veto HV Monitor | 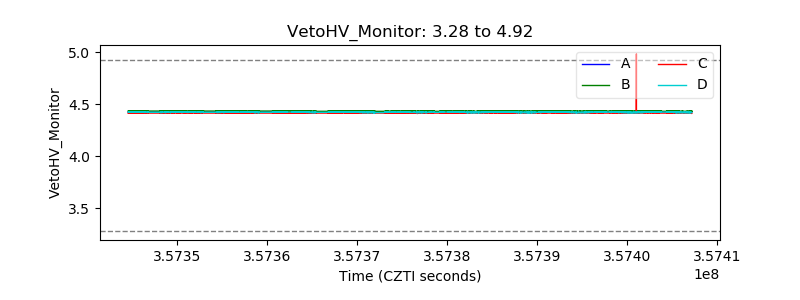 |
| Veto LLD | 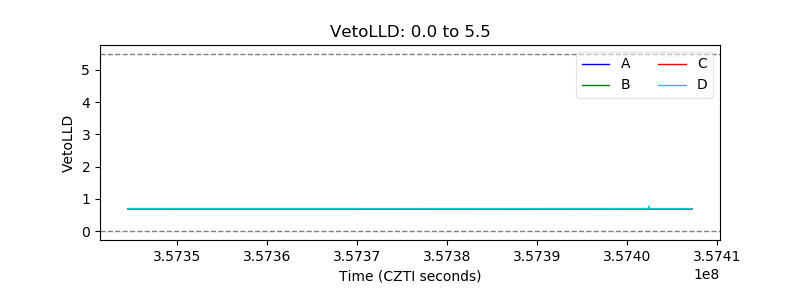 |
| Alpha Counter |  |
| _CPM_Rate |  |
| CZT Counter |  |
| +2.5 Volts monitor |  |
| +5 Volts monitor |  |
| _ROLL_ROT |  |
| _Roll_DEC |  |
| _Roll_RA | 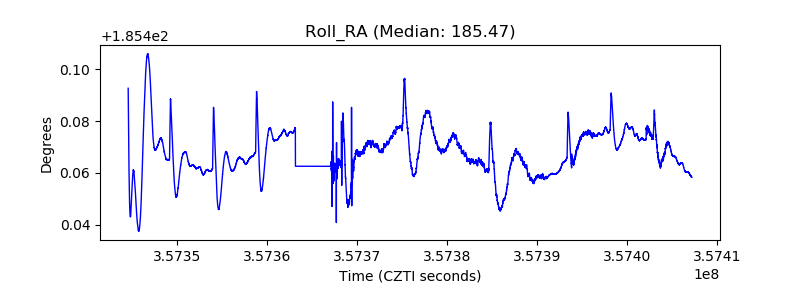 |
| Veto Counter |  |