| Param | Original file | Final file |
|---|---|---|
| Filename | modeM0/AS1A10_050T05_9000004342cztM0_level2_bc.evt | modeM0/AS1A10_050T05_9000004342cztM0_level2_quad_clean.evt |
| Size (bytes) | 2,332,710,720 | 401,757,120 |
| Size | 2.2 GB | 383.1 MB |
| Events in quadrant A | 6,302,199 | 2,669,048 |
| Events in quadrant B | 14,562,146 | 2,637,917 |
| Events in quadrant C | 35,973,765 | 2,240,153 |
| Events in quadrant D | 11,756,213 | 2,540,647 |
| Mode M9 | |||
|---|---|---|---|
| Quadrant | BADHDUFLAG | Total packets | Discarded packets |
| A | 0 | 43 | 0 |
| B | 0 | 43 | 0 |
| C | 0 | 43 | 0 |
| D | 0 | 43 | 0 |
| Mode M0 | |||
|---|---|---|---|
| Quadrant | BADHDUFLAG | Total packets | Discarded packets |
| A | 0 | 62997 | 0 |
| B | 0 | 91756 | 0 |
| C | 0 | 158105 | 0 |
| D | 0 | 81115 | 0 |
| Mode SS | |||
|---|---|---|---|
| Quadrant | BADHDUFLAG | Total packets | Discarded packets |
| A | 0 | 620 | 0 |
| B | 0 | 620 | 0 |
| C | 0 | 620 | 0 |
| D | 0 | 620 | 0 |
| Quadrant | Total seconds | Saturated seconds | Saturation percentage |
|---|---|---|---|
| A | 30221 | 476 | 1.575064% |
| B | 30221 | 693 | 2.293107% |
| C | 30221 | 10254 | 33.930049% |
| D | 30221 | 980 | 3.242778% |
Noise dominated data is calculated using 1-second bins in cleaned event files. If a bin has >2000 counts, and if more than 50% of those come from <1% of pixels, then it is considered to be noise-dominated and hence unusable.
| Quadrant | # 1 sec bins | Bins with >0 counts | Bins with >2000 counts | High rate bins dominated by noise | Noise dominated (total time) | Noise dominated (detector-on time) | Marked lightcurve |
|---|---|---|---|---|---|---|---|
| A | 34676 | 30216 | 0 | 0 | 0.00% | 0.00% |  |
| B | 34676 | 30216 | 2 | 2 | 0.01% | 0.01% |  |
| C | 34676 | 30215 | 1748 | 1748 | 5.04% | 5.79% |  |
| D | 34676 | 30219 | 67 | 67 | 0.19% | 0.22% |  |
Top three noisy pixels from each quadrant. If the there are fewer than three noisy pixels in the level2.evt file, extra rows are filled as -1
| Pixel properties | Quadrant properties | ||||||
|---|---|---|---|---|---|---|---|
| Quadrant | DetID | PixID | Counts | Sigma | Mean | Median | Sigma |
| A | 8 | 192 | 70771 | 198.6 | 1602 | 1572 | 348.4 |
| A | 13 | 254 | 52389 | 145.84 | 1602 | 1572 | 348.4 |
| A | 14 | 254 | 26342 | 71.09 | 1602 | 1572 | 348.4 |
| B | 6 | 159 | 8291583 | 26719.89 | 1599 | 1557 | 310.3 |
| B | 0 | 230 | 69205 | 218.04 | 1599 | 1557 | 310.3 |
| B | 0 | 190 | 63650 | 200.13 | 1599 | 1557 | 310.3 |
| C | 3 | 233 | 30475178 | 91783.39 | 1395 | 1387 | 332.0 |
| C | 2 | 114 | 54012 | 158.5 | 1395 | 1387 | 332.0 |
| C | 15 | 208 | 53510 | 156.99 | 1395 | 1387 | 332.0 |
| D | 7 | 223 | 1402540 | 3727.96 | 1557 | 1516 | 375.8 |
| D | 1 | 52 | 1212622 | 3222.61 | 1557 | 1516 | 375.8 |
| D | 8 | 195 | 1124683 | 2988.61 | 1557 | 1516 | 375.8 |
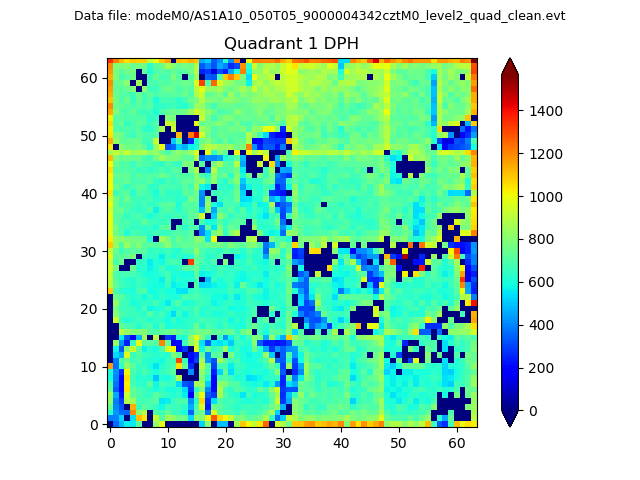
Histogram calculated using DETX and DETY for each event in the final _common_clean file
| Quadrant A |  |
 |
Quadrant B |
|---|---|---|---|
| Quadrant D |  |
 |
Quadrant C |
| Plot type | Count rate plots | Images |
|---|---|---|
| Comparison with Poisson distribution Blue bars denote a histogram of data divided into 1 sec bins. Red curve is a Poisson curve with rate = median count rate of data. |
 |
 |
| Quadrant-wise count rates Data is divided into 100 sec bins |
 |
|
| Module-wise count rates for Quadrant A Data is divided into 100 sec bins |
 |
 |
| Module-wise count rates for Quadrant B Data is divided into 100 sec bins |
 |
 |
| Module-wise count rates for Quadrant C Data is divided into 100 sec bins |
 |
 |
| Module-wise count rates for Quadrant D Data is divided into 100 sec bins |
 |
 |
| Parameter | Plot |
|---|---|
| CZT HV Monitor |  |
| D_VDD |  |
| Temperature 1 |  |
| Veto HV Monitor |  |
| Veto LLD |  |
| Alpha Counter |  |
| _CPM_Rate |  |
| CZT Counter | 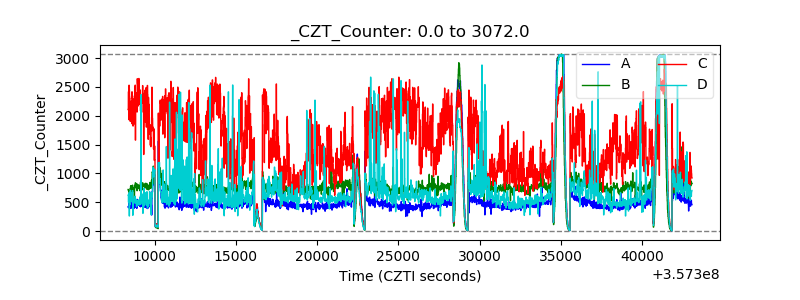 |
| +2.5 Volts monitor |  |
| +5 Volts monitor |  |
| _ROLL_ROT |  |
| _Roll_DEC |  |
| _Roll_RA |  |
| Veto Counter |  |