| Param | Original file | Final file |
|---|---|---|
| Filename | modeM0/AS1A10_102T01_9000004340cztM0_level2_bc.evt | modeM0/AS1A10_102T01_9000004340cztM0_level2_quad_clean.evt |
| Size (bytes) | 5,031,668,160 | 737,861,760 |
| Size | 4.7 GB | 703.7 MB |
| Events in quadrant A | 14,221,741 | 4,919,269 |
| Events in quadrant B | 30,651,292 | 4,954,476 |
| Events in quadrant C | 78,383,663 | 3,722,225 |
| Events in quadrant D | 24,829,231 | 4,398,219 |
| Mode SS | |||
|---|---|---|---|
| Quadrant | BADHDUFLAG | Total packets | Discarded packets |
| A | 0 | 1296 | 0 |
| B | 0 | 1296 | 0 |
| C | 0 | 1296 | 0 |
| D | 0 | 1296 | 0 |
| Mode M9 | |||
|---|---|---|---|
| Quadrant | BADHDUFLAG | Total packets | Discarded packets |
| A | 0 | 104 | 0 |
| B | 0 | 104 | 0 |
| C | 0 | 104 | 0 |
| D | 0 | 104 | 0 |
| Mode M0 | |||
|---|---|---|---|
| Quadrant | BADHDUFLAG | Total packets | Discarded packets |
| A | 0 | 134432 | 0 |
| B | 0 | 191959 | 0 |
| C | 0 | 348525 | 0 |
| D | 0 | 176962 | 0 |
| Quadrant | Total seconds | Saturated seconds | Saturation percentage |
|---|---|---|---|
| A | 63344 | 1007 | 1.589732% |
| B | 63344 | 1595 | 2.517997% |
| C | 63344 | 29631 | 46.777911% |
| D | 63344 | 4809 | 7.591879% |
Noise dominated data is calculated using 1-second bins in cleaned event files. If a bin has >2000 counts, and if more than 50% of those come from <1% of pixels, then it is considered to be noise-dominated and hence unusable.
| Quadrant | # 1 sec bins | Bins with >0 counts | Bins with >2000 counts | High rate bins dominated by noise | Noise dominated (total time) | Noise dominated (detector-on time) | Marked lightcurve |
|---|---|---|---|---|---|---|---|
| A | 74089 | 63341 | 24 | 24 | 0.03% | 0.04% |  |
| B | 74089 | 63341 | 0 | 0 | 0.00% | 0.00% |  |
| C | 74089 | 63337 | 7303 | 7303 | 9.86% | 11.53% | 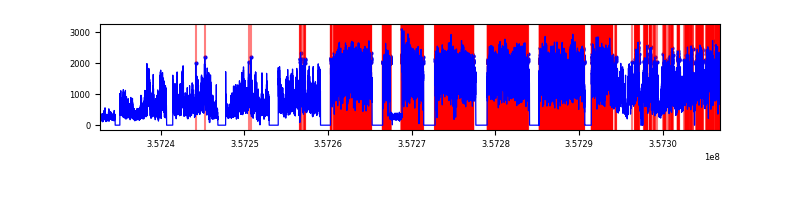 |
| D | 74089 | 63340 | 666 | 666 | 0.90% | 1.05% |  |
Top three noisy pixels from each quadrant. If the there are fewer than three noisy pixels in the level2.evt file, extra rows are filled as -1
| Pixel properties | Quadrant properties | ||||||
|---|---|---|---|---|---|---|---|
| Quadrant | DetID | PixID | Counts | Sigma | Mean | Median | Sigma |
| A | 0 | 13 | 623194 | 829.65 | 3485 | 3424 | 747.0 |
| A | 8 | 192 | 115216 | 149.65 | 3485 | 3424 | 747.0 |
| A | 13 | 254 | 98888 | 127.79 | 3485 | 3424 | 747.0 |
| B | 6 | 159 | 17074394 | 25722.29 | 3516 | 3427 | 663.7 |
| B | 0 | 190 | 76185 | 109.63 | 3516 | 3427 | 663.7 |
| B | 0 | 229 | 36158 | 49.32 | 3516 | 3427 | 663.7 |
| C | 3 | 233 | 67627700 | 105676.88 | 2707 | 2692 | 639.9 |
| C | 15 | 208 | 133014 | 203.65 | 2707 | 2692 | 639.9 |
| C | 2 | 114 | 100420 | 152.72 | 2707 | 2692 | 639.9 |
| D | 1 | 52 | 7068813 | 9310.42 | 3254 | 3161 | 758.9 |
| D | 13 | 104 | 2498212 | 3287.73 | 3254 | 3161 | 758.9 |
| D | 8 | 195 | 1813944 | 2386.07 | 3254 | 3161 | 758.9 |
Histogram calculated using DETX and DETY for each event in the final _common_clean file
| Quadrant A |  |
 |
Quadrant B |
|---|---|---|---|
| Quadrant D |  |
 |
Quadrant C |
| Plot type | Count rate plots | Images |
|---|---|---|
| Comparison with Poisson distribution Blue bars denote a histogram of data divided into 1 sec bins. Red curve is a Poisson curve with rate = median count rate of data. |
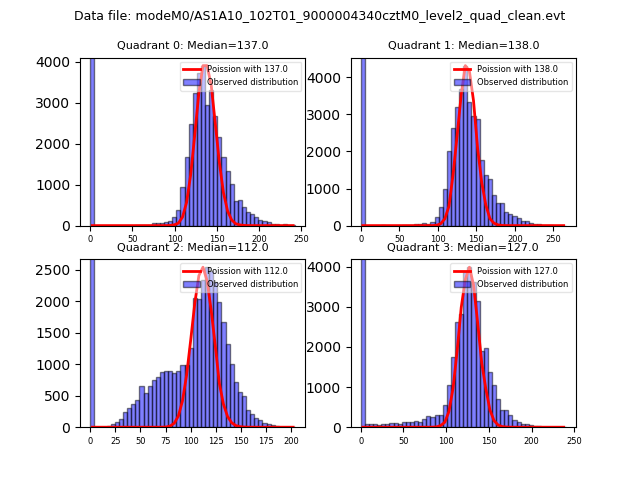 |
 |
| Quadrant-wise count rates Data is divided into 100 sec bins |
 |
|
| Module-wise count rates for Quadrant A Data is divided into 100 sec bins |
 |
 |
| Module-wise count rates for Quadrant B Data is divided into 100 sec bins |
 |
 |
| Module-wise count rates for Quadrant C Data is divided into 100 sec bins |
 |
 |
| Module-wise count rates for Quadrant D Data is divided into 100 sec bins |
 |
 |
| Parameter | Plot |
|---|---|
| CZT HV Monitor |  |
| D_VDD |  |
| Temperature 1 |  |
| Veto HV Monitor |  |
| Veto LLD |  |
| Alpha Counter |  |
| _CPM_Rate |  |
| CZT Counter |  |
| +2.5 Volts monitor | 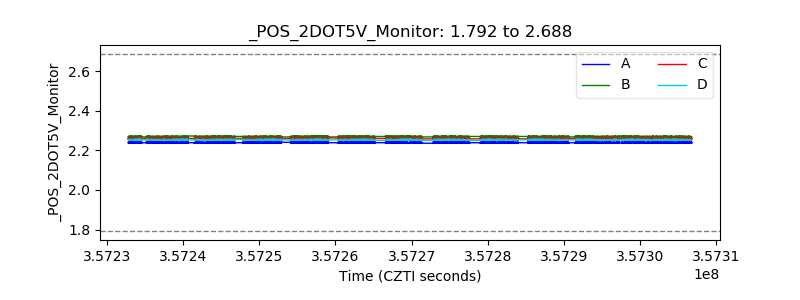 |
| +5 Volts monitor | 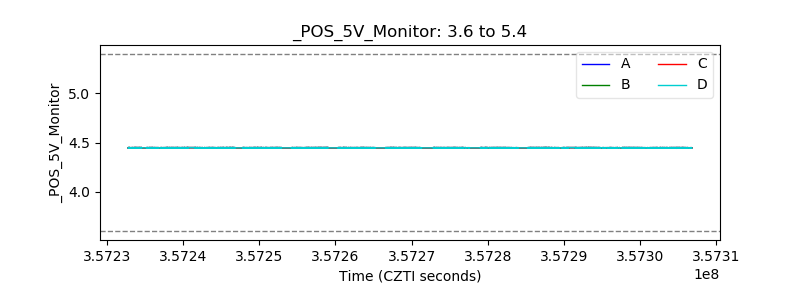 |
| _ROLL_ROT |  |
| _Roll_DEC |  |
| _Roll_RA |  |
| Veto Counter |  |