| Param | Original file | Final file |
|---|---|---|
| Filename | modeM0/AS1A10_021T06_9000004338cztM0_level2_bc.evt | modeM0/AS1A10_021T06_9000004338cztM0_level2_quad_clean.evt |
| Size (bytes) | 892,912,320 | 201,579,840 |
| Size | 851.5 MB | 192.2 MB |
| Events in quadrant A | 3,894,100 | 1,289,718 |
| Events in quadrant B | 7,408,220 | 1,283,004 |
| Events in quadrant C | 9,969,139 | 1,200,080 |
| Events in quadrant D | 4,685,252 | 1,236,208 |
| Mode SS | |||
|---|---|---|---|
| Quadrant | BADHDUFLAG | Total packets | Discarded packets |
| A | 0 | 320 | 0 |
| B | 0 | 320 | 0 |
| C | 0 | 320 | 0 |
| D | 0 | 320 | 0 |
| Mode M9 | |||
|---|---|---|---|
| Quadrant | BADHDUFLAG | Total packets | Discarded packets |
| A | 0 | 5 | 0 |
| B | 0 | 5 | 0 |
| C | 0 | 5 | 0 |
| D | 0 | 5 | 0 |
| Mode M0 | |||
|---|---|---|---|
| Quadrant | BADHDUFLAG | Total packets | Discarded packets |
| A | 0 | 35470 | 0 |
| B | 0 | 48033 | 0 |
| C | 0 | 55242 | 0 |
| D | 0 | 37076 | 0 |
| Quadrant | Total seconds | Saturated seconds | Saturation percentage |
|---|---|---|---|
| A | 15896 | 578 | 3.636135% |
| B | 15896 | 635 | 3.994716% |
| C | 15896 | 1590 | 10.002516% |
| D | 15896 | 504 | 3.170609% |
Noise dominated data is calculated using 1-second bins in cleaned event files. If a bin has >2000 counts, and if more than 50% of those come from <1% of pixels, then it is considered to be noise-dominated and hence unusable.
| Quadrant | # 1 sec bins | Bins with >0 counts | Bins with >2000 counts | High rate bins dominated by noise | Noise dominated (total time) | Noise dominated (detector-on time) | Marked lightcurve |
|---|---|---|---|---|---|---|---|
| A | 16271 | 15896 | 22 | 22 | 0.14% | 0.14% |  |
| B | 16271 | 15897 | 0 | 0 | 0.00% | 0.00% |  |
| C | 16271 | 15896 | 89 | 89 | 0.55% | 0.56% |  |
| D | 16271 | 15897 | 52 | 52 | 0.32% | 0.33% |  |
Top three noisy pixels from each quadrant. If the there are fewer than three noisy pixels in the level2.evt file, extra rows are filled as -1
| Pixel properties | Quadrant properties | ||||||
|---|---|---|---|---|---|---|---|
| Quadrant | DetID | PixID | Counts | Sigma | Mean | Median | Sigma |
| A | 0 | 13 | 771956 | 4312.54 | 806 | 788 | 178.8 |
| A | 13 | 254 | 25302 | 137.09 | 806 | 788 | 178.8 |
| A | 8 | 192 | 8347 | 42.27 | 806 | 788 | 178.8 |
| B | 6 | 159 | 4207143 | 26283.37 | 810 | 788 | 160.0 |
| B | 6 | 36 | 48113 | 295.71 | 810 | 788 | 160.0 |
| B | 0 | 190 | 23614 | 142.62 | 810 | 788 | 160.0 |
| C | 3 | 233 | 6907769 | 37707.43 | 763 | 756 | 183.2 |
| C | 15 | 208 | 90875 | 491.99 | 763 | 756 | 183.2 |
| C | 2 | 114 | 29278 | 155.71 | 763 | 756 | 183.2 |
| D | 1 | 52 | 892253 | 4716.62 | 794 | 771 | 189.0 |
| D | 8 | 195 | 408061 | 2154.88 | 794 | 771 | 189.0 |
| D | 2 | 250 | 87083 | 456.66 | 794 | 771 | 189.0 |
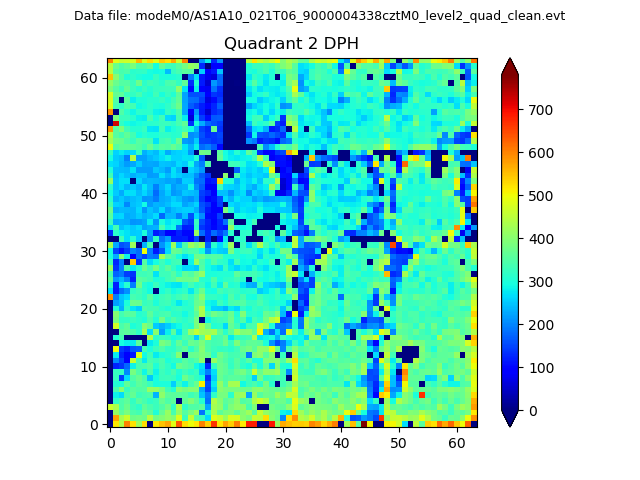
Histogram calculated using DETX and DETY for each event in the final _common_clean file
| Quadrant A |  |
 |
Quadrant B |
|---|---|---|---|
| Quadrant D |  |
 |
Quadrant C |
| Plot type | Count rate plots | Images |
|---|---|---|
| Comparison with Poisson distribution Blue bars denote a histogram of data divided into 1 sec bins. Red curve is a Poisson curve with rate = median count rate of data. |
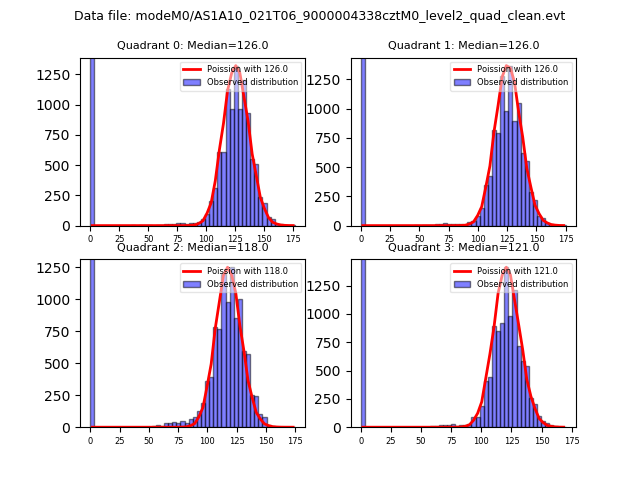 |
 |
| Quadrant-wise count rates Data is divided into 100 sec bins |
 |
|
| Module-wise count rates for Quadrant A Data is divided into 100 sec bins |
 |
 |
| Module-wise count rates for Quadrant B Data is divided into 100 sec bins |
 |
 |
| Module-wise count rates for Quadrant C Data is divided into 100 sec bins |
 |
 |
| Module-wise count rates for Quadrant D Data is divided into 100 sec bins |
 |
 |
| Parameter | Plot |
|---|---|
| CZT HV Monitor |  |
| D_VDD |  |
| Temperature 1 |  |
| Veto HV Monitor | 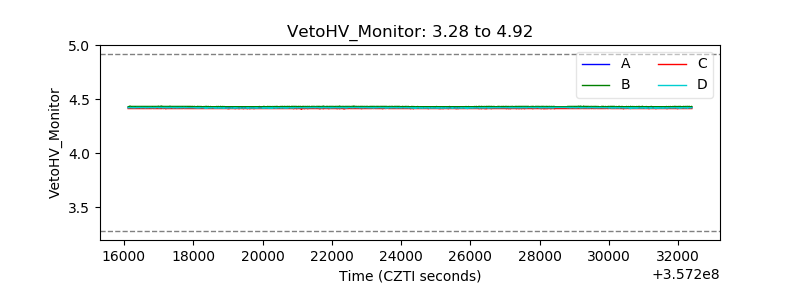 |
| Veto LLD |  |
| Alpha Counter | 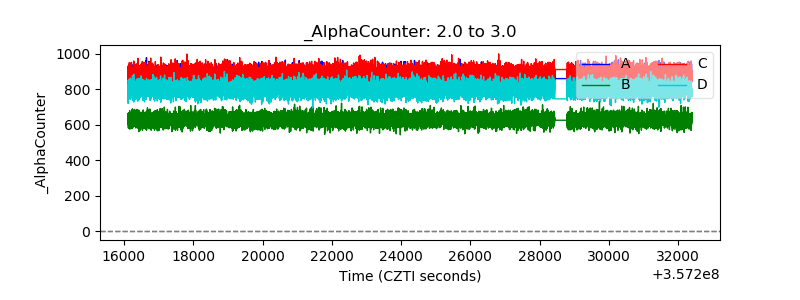 |
| _CPM_Rate |  |
| CZT Counter |  |
| +2.5 Volts monitor | 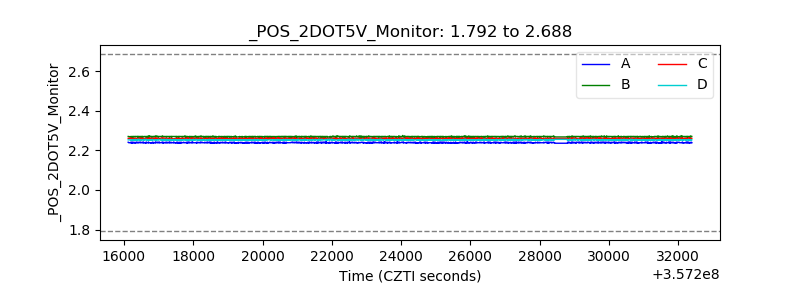 |
| +5 Volts monitor |  |
| _ROLL_ROT | 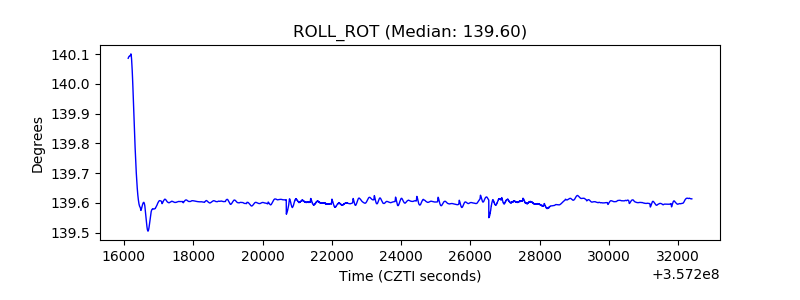 |
| _Roll_DEC |  |
| _Roll_RA | 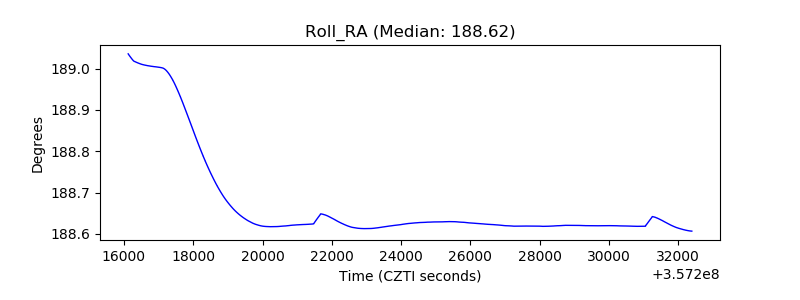 |
| Veto Counter |  |