| Param | Original file | Final file |
|---|---|---|
| Filename | modeM0/AS1A10_097T03_9000004336cztM0_level2_bc.evt | modeM0/AS1A10_097T03_9000004336cztM0_level2_quad_clean.evt |
| Size (bytes) | 11,287,514,880 | 2,565,685,440 |
| Size | 10.5 GB | 2.4 GB |
| Events in quadrant A | 42,831,996 | 16,810,057 |
| Events in quadrant B | 91,928,752 | 16,798,987 |
| Events in quadrant C | 137,509,688 | 15,184,563 |
| Events in quadrant D | 57,148,686 | 16,359,776 |
| Mode M9 | |||
|---|---|---|---|
| Quadrant | BADHDUFLAG | Total packets | Discarded packets |
| A | 0 | 301 | 0 |
| B | 0 | 301 | 0 |
| C | 0 | 301 | 0 |
| D | 0 | 301 | 0 |
| Mode SS | |||
|---|---|---|---|
| Quadrant | BADHDUFLAG | Total packets | Discarded packets |
| A | 0 | 3724 | 0 |
| B | 0 | 3724 | 0 |
| C | 0 | 3724 | 0 |
| D | 0 | 3724 | 0 |
| Mode M0 | |||
|---|---|---|---|
| Quadrant | BADHDUFLAG | Total packets | Discarded packets |
| A | 0 | 394678 | 0 |
| B | 0 | 560404 | 0 |
| C | 0 | 725294 | 0 |
| D | 0 | 430746 | 0 |
| Quadrant | Total seconds | Saturated seconds | Saturation percentage |
|---|---|---|---|
| A | 183281 | 3423 | 1.867624% |
| B | 183280 | 4523 | 2.467809% |
| C | 183280 | 39733 | 21.678852% |
| D | 183281 | 3229 | 1.761776% |
Noise dominated data is calculated using 1-second bins in cleaned event files. If a bin has >2000 counts, and if more than 50% of those come from <1% of pixels, then it is considered to be noise-dominated and hence unusable.
| Quadrant | # 1 sec bins | Bins with >0 counts | Bins with >2000 counts | High rate bins dominated by noise | Noise dominated (total time) | Noise dominated (detector-on time) | Marked lightcurve |
|---|---|---|---|---|---|---|---|
| A | 213122 | 183276 | 136 | 136 | 0.06% | 0.07% |  |
| B | 213122 | 183280 | 16 | 16 | 0.01% | 0.01% |  |
| C | 213122 | 183267 | 5766 | 5766 | 2.71% | 3.15% |  |
| D | 213122 | 183288 | 393 | 393 | 0.18% | 0.21% |  |
Top three noisy pixels from each quadrant. If the there are fewer than three noisy pixels in the level2.evt file, extra rows are filled as -1
| Pixel properties | Quadrant properties | ||||||
|---|---|---|---|---|---|---|---|
| Quadrant | DetID | PixID | Counts | Sigma | Mean | Median | Sigma |
| A | 0 | 13 | 3382978 | 1570.36 | 10065 | 9916 | 2148.0 |
| A | 13 | 254 | 328593 | 148.36 | 10065 | 9916 | 2148.0 |
| A | 8 | 192 | 326695 | 147.48 | 10065 | 9916 | 2148.0 |
| B | 6 | 159 | 51475797 | 27255.7 | 10074 | 9836 | 1888.3 |
| B | 0 | 190 | 572057 | 297.74 | 10074 | 9836 | 1888.3 |
| B | 3 | 64 | 321609 | 165.11 | 10074 | 9836 | 1888.3 |
| C | 3 | 233 | 101605002 | 47489.6 | 9055 | 9037 | 2139.3 |
| C | 14 | 254 | 482457 | 221.29 | 9055 | 9037 | 2139.3 |
| C | 2 | 114 | 324225 | 147.33 | 9055 | 9037 | 2139.3 |
| D | 8 | 195 | 5862213 | 2477.94 | 10017 | 9760 | 2361.8 |
| D | 12 | 227 | 3416717 | 1442.51 | 10017 | 9760 | 2361.8 |
| D | 1 | 52 | 2372843 | 1000.53 | 10017 | 9760 | 2361.8 |
Histogram calculated using DETX and DETY for each event in the final _common_clean file
| Quadrant A |  |
 |
Quadrant B |
|---|---|---|---|
| Quadrant D |  |
 |
Quadrant C |
| Plot type | Count rate plots | Images |
|---|---|---|
| Comparison with Poisson distribution Blue bars denote a histogram of data divided into 1 sec bins. Red curve is a Poisson curve with rate = median count rate of data. |
 |
 |
| Quadrant-wise count rates Data is divided into 100 sec bins |
 |
|
| Module-wise count rates for Quadrant A Data is divided into 100 sec bins |
 |
 |
| Module-wise count rates for Quadrant B Data is divided into 100 sec bins |
 |
 |
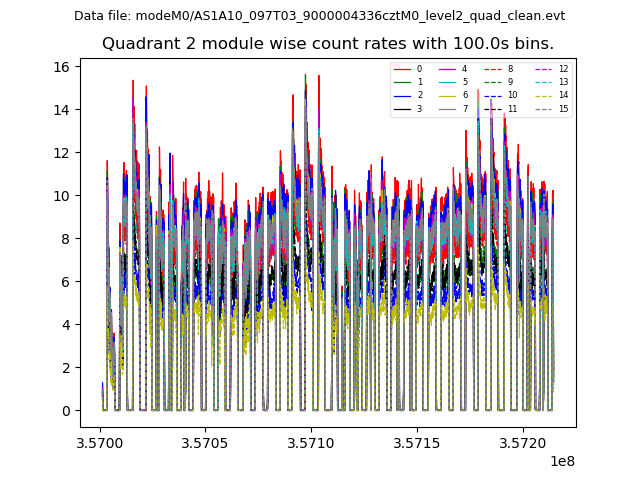
| Module-wise count rates for Quadrant C Data is divided into 100 sec bins |
 |
 |
| Module-wise count rates for Quadrant D Data is divided into 100 sec bins |
 |
 |
| Parameter | Plot |
|---|---|
| CZT HV Monitor |  |
| D_VDD |  |
| Temperature 1 |  |
| Veto HV Monitor |  |
| Veto LLD |  |
| Alpha Counter |  |
| _CPM_Rate |  |
| CZT Counter |  |
| +2.5 Volts monitor |  |
| +5 Volts monitor |  |
| _ROLL_ROT |  |
| _Roll_DEC |  |
| _Roll_RA |  |
| Veto Counter |  |